Carvana Stock (CVNA) Skyrockets 11,543% After Crashing 99%

Quick overview
- Carvana Co. (CVNA) has experienced a remarkable 11,543% surge over the past two and a half years, reclaiming its previous all-time high near $377.
- The stock is currently facing critical resistance at $377, with bearish divergences emerging in momentum indicators suggesting potential weakness.
- Key support levels are identified at $265 and $166, which could provide stability if the stock undergoes a retracement.
- A decisive breakout above $414 could lead to new highs, while failure to maintain above $377 may trigger a corrective phase.
Carvana Co. (CVNA) has staged one of Wall Street’s most dramatic comebacks. After crashing nearly 99%, the stock has surged an astonishing 11,543% in just two and a half years. Now trading back at its peak, the question is whether Carvana will break into new all-time highs or face another bearish rejection.
Carvana Stock Faces Critical Resistance at $377
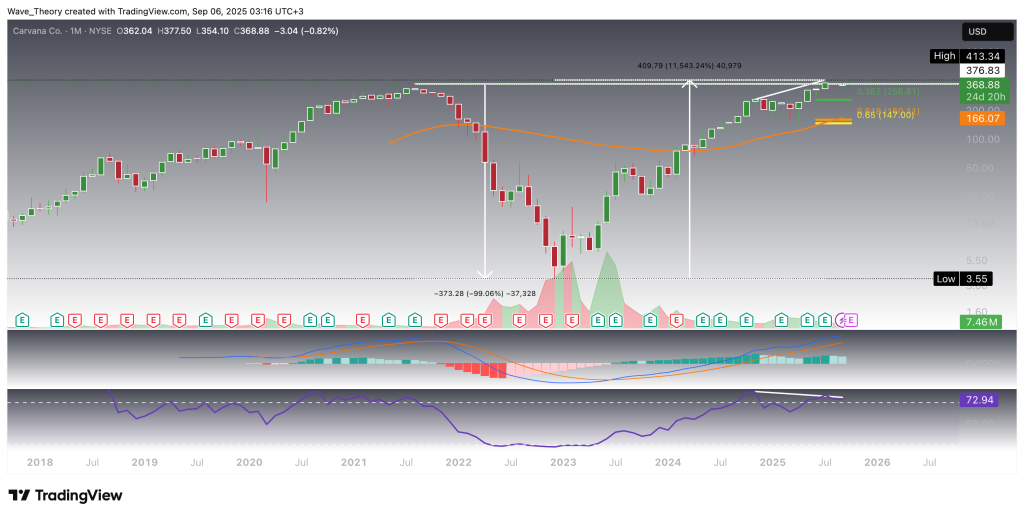
Carvana (CVNA) has sustained a robust uptrend over the past two and a half years, reclaiming its prior all-time high near $377 and briefly extending to a fresh peak at $414. This zone now represents a pivotal inflection point, as price action encounters heavy resistance.
From a momentum standpoint, warning signals are beginning to emerge. On the monthly timeframe, the RSI has printed a bearish divergence, suggesting that underlying strength is waning despite higher price highs. Complementing this signal, the MACD histogram turned lower last month, reflecting a loss of bullish momentum. However, the MACD lines themselves remain in a constructive bullish cross, keeping the broader trend intact for now.
Should the stock fail to hold its current levels and undergo a deeper retracement, Fibonacci analysis highlights meaningful support zones at $257 and $147. Additionally, the 50-month EMA provides further structural support at $166, which could serve as a key level for long-term buyers.
In short, Carvana stands at a decisive juncture: either it overcomes its all-time high resistance to extend its historic rally, or it risks a corrective phase toward deeper technical support.
Bearish Divergences Emerging on the Weekly Chart
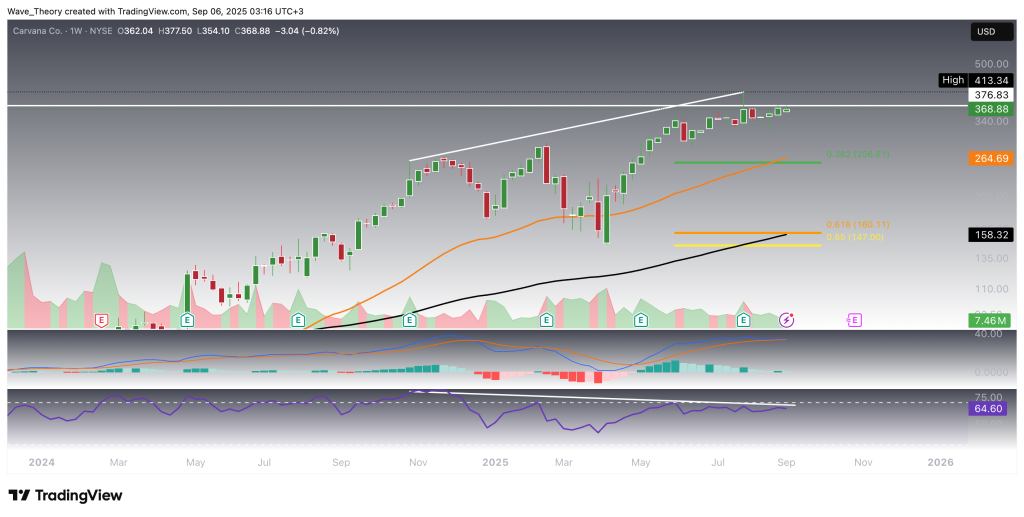
On the weekly timeframe, momentum is beginning to flash early caution signals. The RSI has formed a clear bearish divergence, while the MACD histogram has started to tick lower this week, pointing to waning bullish momentum. Despite these developments, the EMAs and MACD lines remain firmly in bullish alignment, underscoring that the broader mid-term trend is still constructive.
Of particular interest, both the 50-week and 200-week EMAs align closely with Fibonacci retracement support levels at approximately $265 and $158. This confluence of technical factors reinforces these zones as areas of strong potential demand, where price could stabilize and even stage a bullish rebound if tested.
In essence, while divergences suggest the risk of a corrective move, the structure of the trend and clustered support levels provide Carvana with a technical foundation for resilience in the weeks ahead.
Mixed Signals on the Daily Chart
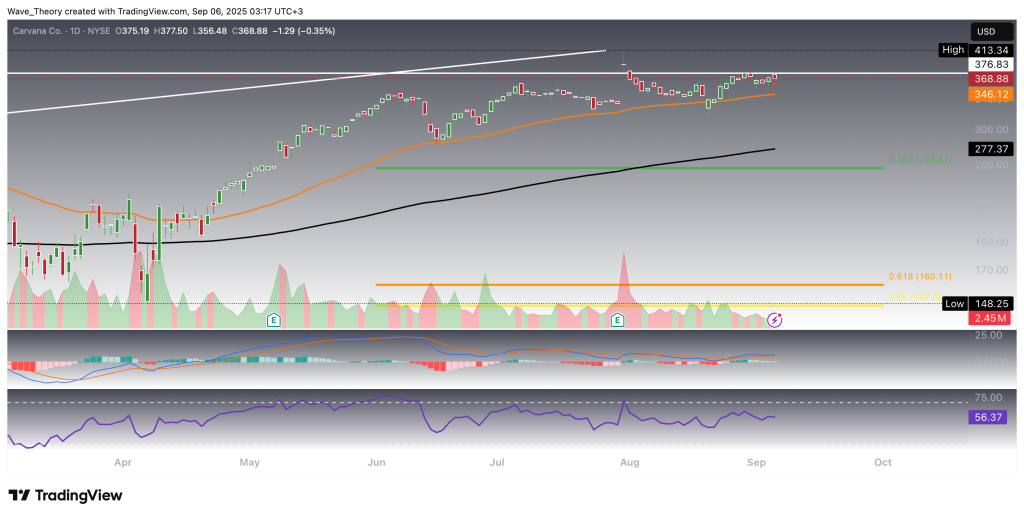
On the daily timeframe, Carvana presents a blend of bullish structure and emerging cautionary signs. The EMAs have recently formed a golden cross, confirming short- to medium-term trend strength, while the MACD lines remain in a bullish crossover and the RSI consolidates in neutral territory — all supportive of continued upward momentum.
However, the MACD histogram has been trending lower over the past several sessions, indicating that buying pressure is beginning to weaken despite the broader bullish setup.
At present, Carvana faces key resistance at the $377 level, with immediate downside support provided by the 50-day EMA near $346. A decisive break on either side of this range will likely define the stock’s next directional move.
 CVNA
CVNA
Similar Outlook on the 4H Chart
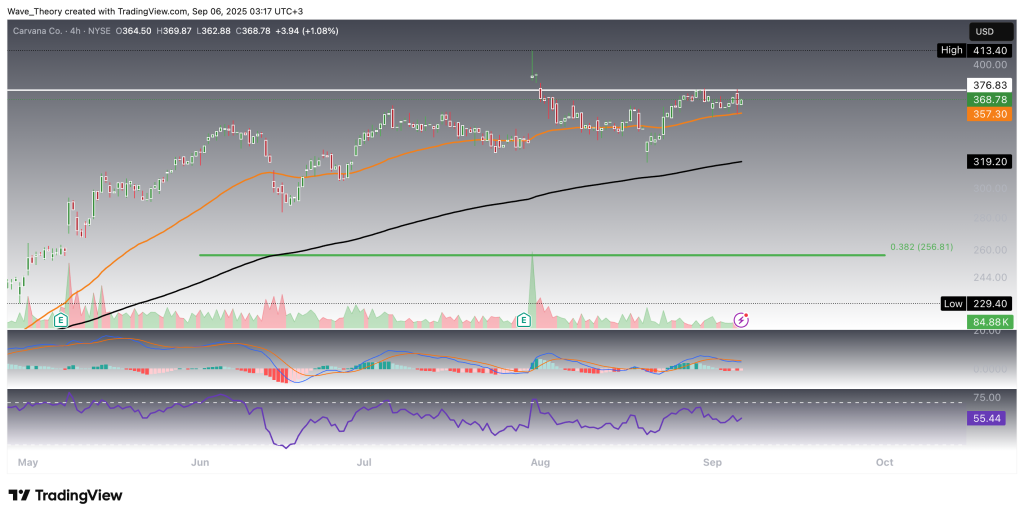
The 4-hour chart closely mirrors the dynamics observed on the daily timeframe. The EMAs have established a golden crossover, reaffirming short-term bullish trend alignment. The RSI remains positioned in neutral territory, suggesting balanced momentum without signs of overextension.
Notably, the MACD histogram has begun to tick higher, signaling a potential recovery in buying pressure. However, the MACD lines remain bearishly crossed, reflecting that short-term momentum has not yet fully confirmed a bullish reversal.
Overall, the 4H chart reinforces the constructive near-term trend but highlights that confirmation from momentum indicators is still pending.
Carvana (CVNA) – Technical Summary
-
Trend Overview:
Carvana has rallied 11,543% over the past 2.5 years, reclaiming its all-time high zone. The broader trend remains bullish, but momentum indicators across multiple timeframes are flashing early warning signs. -
Bearish Signals:
-
Monthly & Weekly RSI show bearish divergences.
-
MACD histograms are rolling over on higher timeframes.
-
4H MACD lines remain bearishly crossed despite price strength.
-
-
Bullish Structure:
-
EMAs across Daily & 4H charts show golden crossovers.
-
MACD lines on higher timeframes remain bullishly crossed.
-
RSI on short-term charts sits in neutral territory, leaving room for movement.
-
-
Key Resistance Levels:
-
$377 (previous all-time high, heavy resistance)
-
$414 (new all-time high, breakout trigger)
-
-
Key Support Levels:
-
$346 (50-day EMA)
-
$265 (Fib + 50-week EMA)
-
$166 (50-month EMA)
-
$158–147 (deep Fib + 200-week EMA confluence)
-
Takeaway: Carvana sits at a critical inflection point. A breakout above $414 would open the door to price discovery, while failure to hold above $377 risks a corrective move toward the $265–$166 support cluster.
- Check out our free forex signals
- Follow the top economic events on FX Leaders economic calendar
- Trade better, discover more Forex Trading Strategies
- Open a FREE Trading Account
- Read our latest reviews on: Avatrade, Exness, HFM and XM
Related Articles
Sidebar rates
