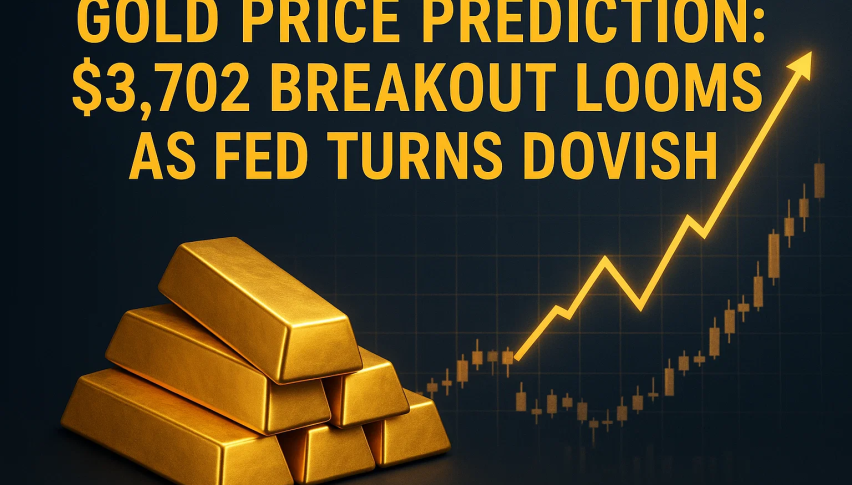
Gold Price Prediction: $3,702 Breakout Looms as Fed Turns Dovish
Gold starts the week glued near record territory as traders digest the Fed’s 25 bps cut and brace for a busy slate of Fedspeak...
Quick overview
- Gold remains near record highs as traders react to the Fed's recent interest rate cut and prepare for upcoming economic indicators.
- The current market conditions favor gold due to lower opportunity costs and sustained demand from geopolitical risks and central bank purchases.
- Technical analysis shows gold is forming an ascending triangle, with key resistance at $3,698–$3,702 and support around $3,667–$3,670.
- Traders are advised to consider buying on dips or waiting for a breakout above $3,702 for potential upward momentum.
Gold starts the week glued near record territory as traders digest the Fed’s 25 bps cut and brace for a busy slate of Fedspeak plus the core PCE inflation gauge. Spot bullion hovered around the $3,690s in early trade, within striking distance of last week’s all-time high near $3,707, while front-month futures ticked higher as well.
The fundamental backdrop is straightforward: softer policy guidance lowers the opportunity cost of holding non-yielding assets, keeps real yields contained, and tends to funnel demand toward havens like gold.
Year-to-date, bullion’s advance has been amplified by geopolitical risks and persistent central-bank buying, a combination that’s helped keep prices elevated even on pullbacks.
Gold chart view: triangle at $3,698–$3,702
On the 2-hour chart, price is compressing into an ascending triangle: higher lows along a rising trendline press against a flat supply band at $3,698–$3,702. The 50-SMA (~$3,670) is trending up beneath price, repeatedly catching dips, while RSI (~63) leans bullish without flashing overbought. Candles at the ceiling show doji/spinning-top hesitation (upper wicks = supply), but there’s no clear bearish divergence yet.
Gold Outlook
Fed rate cut weaker USD, bullish gold
Geopolitical & social risks safe haven demand
Inflation hedge narrative still alive Technicals:
Bounce from $3,621–$3,663 demand zone
Key resistance $3,700–$3,720
Breakout above = $3,800+ target
Bias = Bullish 💙💙 pic.twitter.com/B09P6ij0GT— SOLEX❤️🔥🫶 (@solostixz) September 22, 2025
A decisive close above $3,702 would typically convert supply into support and invite momentum follow-through; confirmation could arrive via a bullish engulfing or a three-candle drive akin to three white soldiers. Failure here—especially a shooting star or bearish engulfing at the ceiling—risks a rotation back toward $3,667 and $3,649. A trendline break would expose $3,628 and $3,612; the 200-SMA (~$3,519) sits far below, underscoring how extended the primary uptrend remains.
Trading plan: levels and triggers
For now, the path of least resistance is higher—if buyers clear the lid. Two clean ways to participate while keeping risk defined:
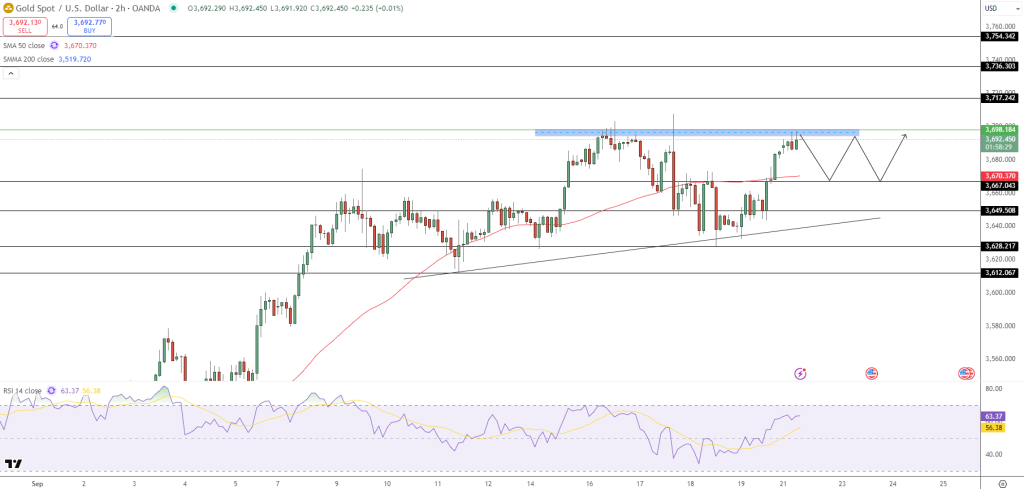
- Buy the dip: If price pulls into $3,667–$3,670 and prints a hammer/bullish engulfing on a 2-hour close, consider a long. Stop: below $3,644 (under swing base/trendline). Targets: $3,698, $3,717; $3,736 on strong momentum.
- Breakout–retest: If gold closes above $3,702, wait for a shallow retest of $3,698–$3,702 to hold (small-body candle or fresh engulfing), then go long. Stop: $3,684. Targets: $3,717, $3,736; stretch to $3,754 on follow-through.
Quick levels to watch
- Resistance: $3,698–$3,702; $3,717; $3,736; $3,754
- Support: $3,667–$3,670; $3,649; $3,628; $3,612
- Invalidation: firm close below $3,644 or a three black crows sequence
If incoming Fed remarks or a cooler-than-feared PCE print reinforce the easing path, that could be the nudge bulls need to flip $3,702 into a launchpad. Conversely, a hawkish surprise would likely keep price ping-ponging inside the triangle until the market gets a clearer signal.
- Check out our free forex signals
- Follow the top economic events on FX Leaders economic calendar
- Trade better, discover more Forex Trading Strategies
- Open a FREE Trading Account
- Read our latest reviews on: Avatrade, Exness, HFM and XM