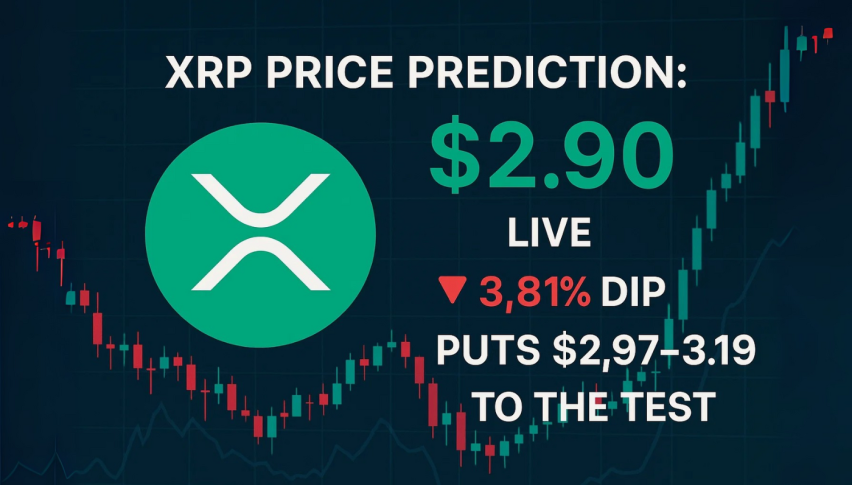
XRP Price Prediction: $2.90 Live, 3.81% Dip Puts $2.97–$3.19 to the Test
XRP is trading near $2.90, down 3.81% on the day, with $4.65B in 24-hour volume. It holds #3 by market cap at roughly $173.19B...
Quick overview
- XRP is currently trading at $2.90, down 3.81% with a market cap of approximately $173.19B.
- The price has faced downward pressure after failing to break a key resistance level at $3.19.
- Technical indicators suggest a cautious outlook, with potential support around $2.80–$2.79 and resistance at $2.95–$2.97.
- A bullish reversal pattern is needed for a shift in momentum, while a close above $2.97 could indicate a loss of seller control.
XRP is trading near $2.90, down 3.81% on the day, with $4.65B in 24-hour volume. It holds #3 by market cap at roughly $173.19B, with 59.78B XRP circulating out of a 100B maximum. In plain English: liquidity is deep, interest is high, but price is under pressure after failing to clear a key ceiling.
- 24h Volume: $4,649,020,202
- Market Cap: $173,187,413,225
- Rank: #3 | Circulating: 59,777,241,479 | Max: 100,000,000,000
Why the tone turned cautious
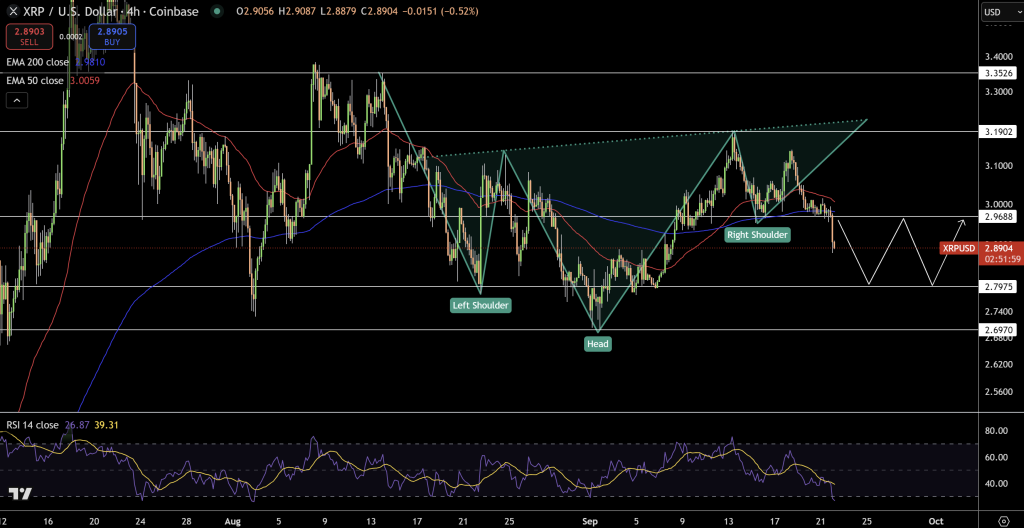
The 4-hour chart flipped from hopeful to guarded after price rejected the rising neckline near $3.19 and then slipped below $2.97—a former range floor clustered around the 200-EMA (~$2.96). That zone is now supply. The decline arrived in a run of wide-body red candles—close to a mini “three black crows”—which signals sellers in control. Price sits around $2.89, below the 50-EMA (~$3.01) and 200-EMA (~$2.96); the 50-EMA is flattening, a common prelude to trend transition.
Structurally, the inverse head-and-shoulders sketched in summer is unconfirmed because bulls never closed through $3.19. Instead, XRP is rotating toward the $2.80–$2.79 demand shelf that caught multiple August lows. Candlesticks show long lower shadows on intraday dips—there are dip buyers—but the RSI near 27 says “oversold,” not “reversed.” A hammer, bullish engulfing, or morning star emerging at $2.80 would be the first credible sign of support stabilizing.
XRP Technical roadmap & trade idea
Until buyers prove it, rallies into broken support are suspect. The first battleground is a retest of $2.95–$2.97—the underside of prior support and the EMAs. If a shooting star or bearish engulfing forms here on the 4-hour close, it often precedes another leg lower toward the $2.86 pivot and the $2.80–$2.79 shelf.
Simple plan:
Consider a short on confirmation if price retests $2.95–$2.97 and prints a bearish reversal candle. Place a stop above $3.05 (beyond the 50-EMA and recent wicks). Targets: first $2.86, then $2.80–$2.79 where horizontal support and prior demand meet. If momentum accelerates, a small runner can trail toward $2.70. This respects the principle that “old support becomes new resistance,” uses EMAs as objective guardrails, and keeps risk defined.
XRP Invalidation & bullish pivot:
If XRP closes back above $2.97–$3.00 and holds, step aside—sellers are losing grip. A sequence of three steady green candles (three white soldiers) or a bullish engulfing above that zone would shift focus back to $3.10 and the $3.19 neckline. Only a firm daily close above $3.19 would revive the inverse H&S and open room for a larger upswing.
- Check out our free forex signals
- Follow the top economic events on FX Leaders economic calendar
- Trade better, discover more Forex Trading Strategies
- Open a FREE Trading Account
- Read our latest reviews on: Avatrade, Exness, HFM and XM