Gold Price Forecast: Powell Looms as $3,746 High Risks $3,715 Reversal
Gold price steadies near $3,746 ahead of Powell. See why traders eye $3,715 as key support in this week’s technical and Fed-driven outlook.

Quick overview
- Gold is trading near $3,746, supported by expectations of US rate cuts and a weaker dollar.
- Analysts are divided on gold's future, with some citing strong monetary policy support while others warn of potential technical fatigue.
- The Federal Reserve's internal debates have created uncertainty, with markets anticipating a 90% chance of a rate cut in October.
- Technical analysis suggests a potential pullback for gold, with key support levels identified at $3,731 and $3,715.
GOLD held near $3,746 on Tuesday after hitting a new high as expectations of more US rate cuts and a softer dollar supported the metal. The US dollar index (DXY) fell again making gold cheaper for overseas buyers. Traders are waiting for Fed Chair Jerome Powell’s speech at 16:35 GMT for clues, with the US Personal Consumption Expenditures index on Friday adding to the anticipation.
Analysts are divided. Kyle Rodda of Capital.com said gold’s strength is “mainly due to monetary policy expectations, lower interest rates and upside risks to inflation”. Others like OANDA’s Kelvin Wong warned of near term technical fatigue despite the broader bullish trend.
Fed Cuts Create Market Uncertainty
Fresh debate inside the Fed has kept investors guessing. New Governor Stephen Miran said the Fed risks tightening too much unless it cuts aggressively, contradicting colleagues who are cautious on inflation. Markets are pricing a 90% chance of a 25bps cut in October and 75% in December according to CME’s FedWatch tool.
This tug of war has put gold in the spotlight as a hedge. With the dollar falling and yields softening, gold is attractive but technicals suggest the rally may be due for a pause.
Gold Technical Analysis: Pullback Ahead
On the 4 hour chart gold reached $3,746 before stalling just short of $3,759 Fibonacci extension. Candlesticks have turned into spinning tops, indicating indecision, while the Relative Strength Index is overbought at 73.
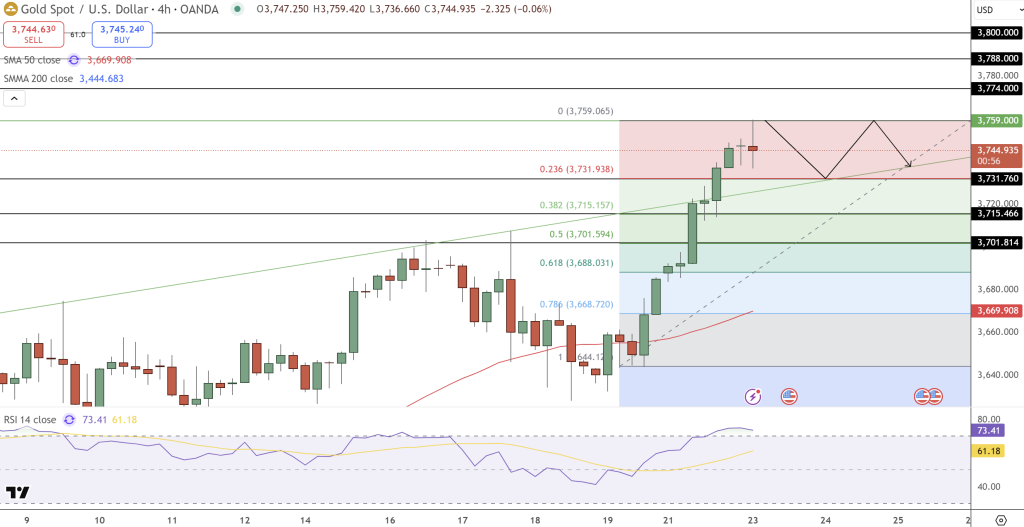
Support is at $3,731 where the 23.6% retracement meets the trendline and previous resistance. A break lower could see $3,715 (38.2%) and $3,701 (50%) both buy zones. Above $3,759 opens the way to $3,774 and $3,788.
For traders a tactical play is to short at $3,746-$3,750 with stops above $3,762 and targets at $3,715. This is to catch a correction rather than chase the momentum. Conservative players may wait for clearer signals such as a bearish engulfing or shooting star before getting in.
- Check out our free forex signals
- Follow the top economic events on FX Leaders economic calendar
- Trade better, discover more Forex Trading Strategies
- Open a FREE Trading Account
- Read our latest reviews on: Avatrade, Exness, HFM and XM
Related Articles


Sidebar rates
Related Posts
