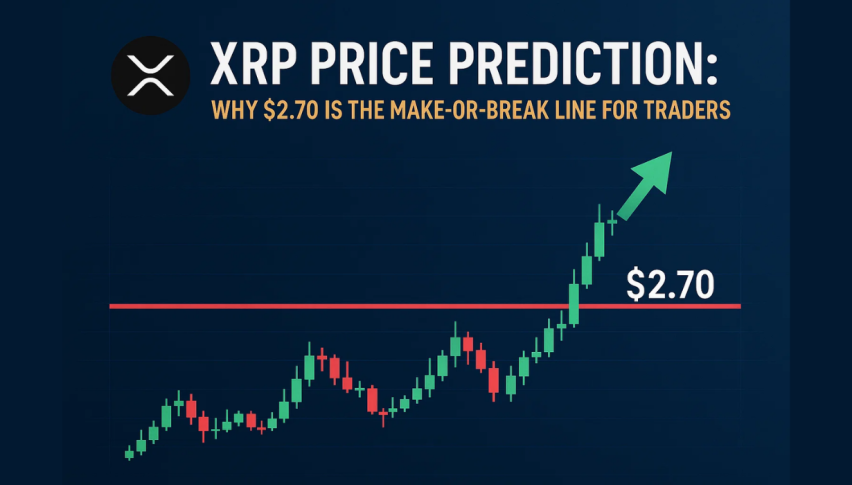
XRP Price Prediction: Why $2.70 Is the Make-Or-Break Line for Traders
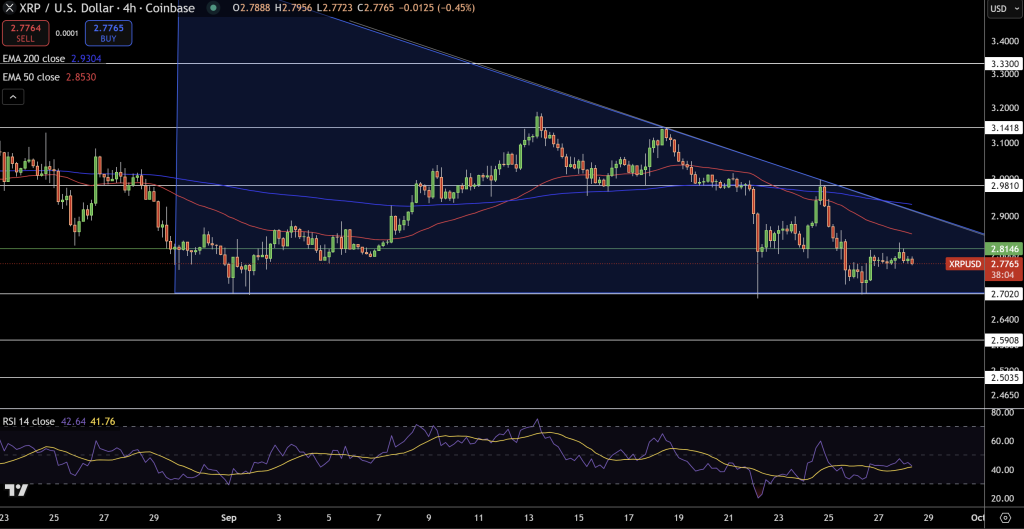
XRP is hovering around $2.78, trying to stay afloat in a descending triangle that’s had no upside momentum since early September.
Quick overview
- XRP is currently priced at $2.78, trapped in a descending triangle with strong selling pressure and horizontal support at $2.70.
- The market shows bearish bias with the 50 and 200 period EMAs sloping down, and sellers quickly pushing prices down when XRP attempts to rise above $2.85.
- The RSI indicates potential for sideways movement but lacks bullish divergence, suggesting no imminent reversal.
- Traders are advised to consider shorting if XRP bounces to $2.85-$2.90 without breaking through, while a long position is only viable if it closes above $3.00.
XRP is hovering around $2.78, trying to stay afloat in a descending triangle that’s had no upside momentum since early September. On the chart we see a series of lower highs pushing down on a horizontal support at $2.70 which has been tested multiple times without giving in. This is a clamp: sellers are pushing down, buyers are holding the line.
The 50 period EMA at $2.85 and the 200 period EMA at $2.93 are both sloping down, so the bias is bearish. Every time XRP tries to go above $2.85, long upper wicks appear, meaning sellers are quick to push price back down. Recently small bodied candles are dominating, reflecting market indecision—and past sharp declines were the “three black crows” pattern, which is sustained bearish pressure.
XRP Momentum and Price Signals in Focus
The RSI is at 42 and is creeping above oversold, so the market has room for sideways or mild consolidation—but it’s not showing a bullish divergence that would indicate a reversal. If buyers can push higher lows above $2.70 that could be the start of a base.
Resistance is at $2.98 and $3.14, while support is at $2.70, $2.59 and $2.50. The triangle is nearing the point of pressure and the next move could be big—either a break above the trendline or a slam through the floor.
XRP/USD Trade Setup & Risk Plan
Here’s a trade idea for both newbies and seasoned traders:
You can short if XRP bounces to $2.85-$2.90 but fails to break through—expect targets first at $2.70 and if that breaks, next at $2.59. Place a stop above $2.95 to limit risk. On the flip side, a long play only makes sense if XRP closes above $3.00 which would open the way to $3.14.
In simpler terms: XRP is in a “squeeze zone”. Unless it gets out of that descending triangle convincingly, rallies will fail and downside setups will remain in play.
- Check out our free forex signals
- Follow the top economic events on FX Leaders economic calendar
- Trade better, discover more Forex Trading Strategies
- Open a FREE Trading Account
- Read our latest reviews on: Avatrade, Exness, HFM and XM