Better Home (BETR) Stock Soars — Is This the Start of a Major Bull Run?

Quick overview
- Better Home (BETR) stock has surged over 1,120% from its lows, indicating a significant recovery after a previous collapse.
- The monthly chart shows strong bullish momentum, with the MACD histogram rising and the RSI suggesting further upside potential.
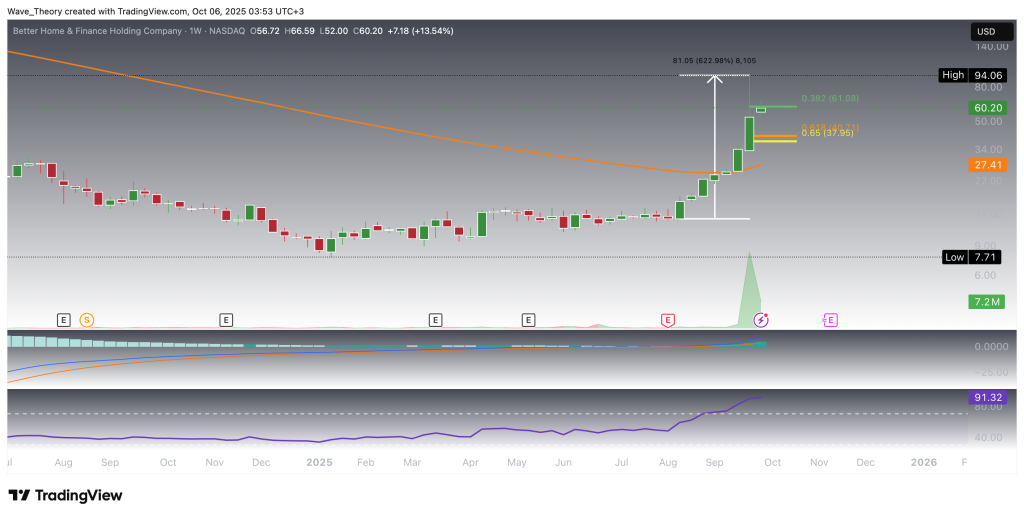
- Despite signs of potential exhaustion on the weekly chart, overall momentum remains in favor of buyers, with key resistance levels identified.
- The daily and 4-hour charts exhibit mixed signals, with golden crossovers indicating bullish trends, but caution is advised due to potential short-term volatility.
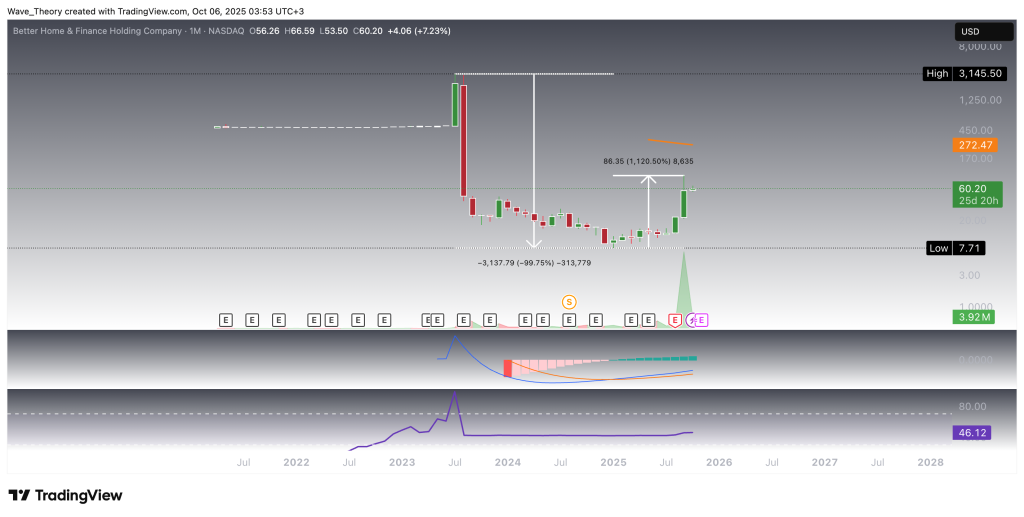
After Better Home (BETR) stock collapsed by nearly 99.8% over the past two years, the tide appears to be turning. In recent months, BETR has launched an extraordinary recovery rally, soaring more than 1,120% from its lows. With bullish momentum building, investors are now asking the key question — is this just the beginning of a much larger reversal?
Bullish Momentum Strengthens on BETR’s Monthly Chart
Better Home (BETR) stock has staged an extraordinary rally of over 1,120% since the beginning of the year, signaling a major shift in momentum. On the monthly timeframe, the MACD histogram continues to build higher, reflecting a strong and sustained uptrend in buying pressure, while the MACD lines remain bullishly crossed, further confirming the upward bias. Meanwhile, the RSI hovers in neutral territory — suggesting there is still room for further upside before entering overbought conditions. Should BETR continue its upward trajectory, significant resistance lies at the 50-month-EMA at $272.5.
Is a Correction Overdue for Better Home (BETR) Stock?
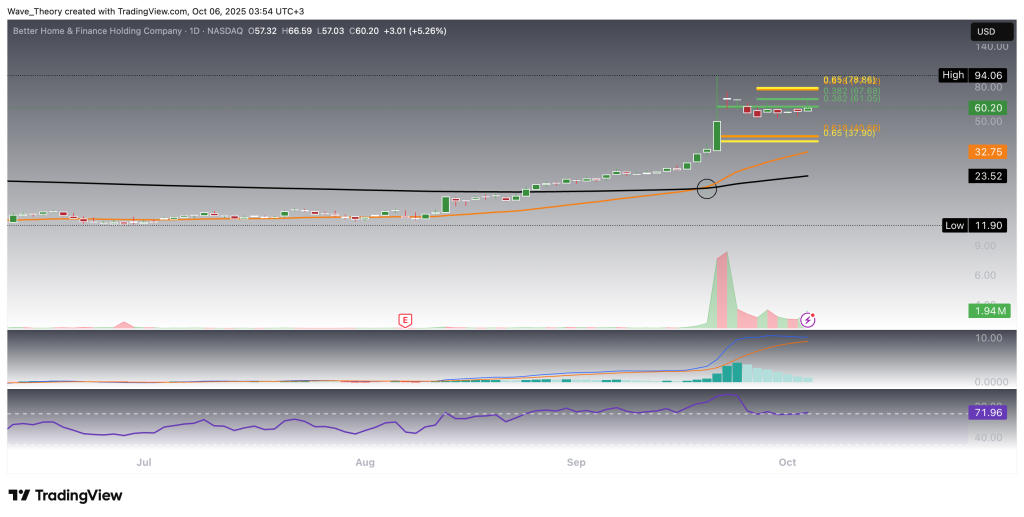
Better Home Stock Presents Golden Crossover on the Daily Chart
On the daily chart, Better Home (BETR) displays mixed technical signals. The EMAs have formed a golden crossover, confirming a bullish trend in the short- to medium term. Additionally, the MACD lines remain bullishly crossed, though the MACD histogram has been ticking bearishly lower over the past few sessions — a potential sign of slowing momentum.
Meanwhile, the RSI hovers near overbought territory, yet shows no clear bearish divergence. For BETR to invalidate the ongoing correction phase, the price must break through the Fibonacci resistance levels at $67.7 and $78. Only a decisive breakout above the golden ratio level at $78 would pave the way for a retest of the recent high at $94, or potentially a continuation toward new highs.
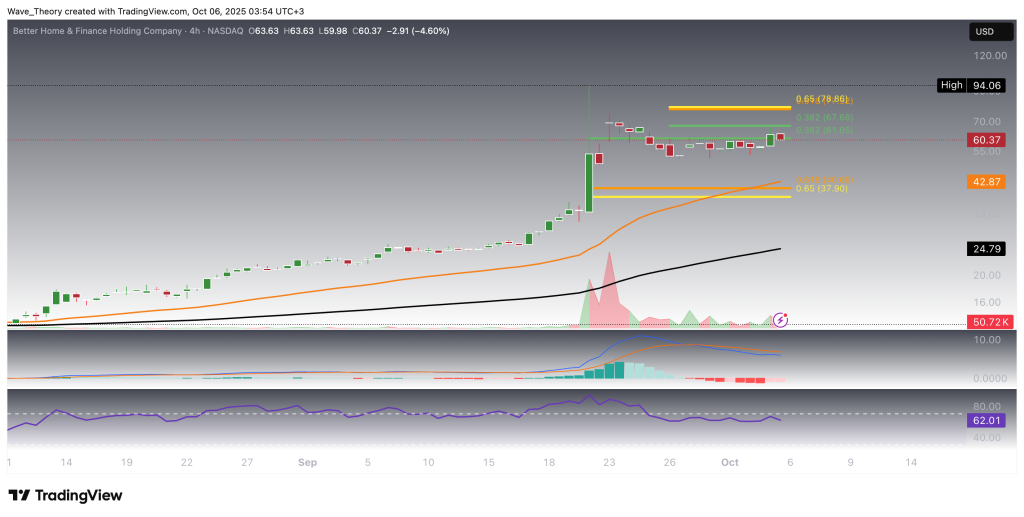
Similar Outlook on the BETR 4H Chart
On the 4-hour chart, Better Home (BETR) shows a comparable technical setup. The EMAs have formed a golden crossover, confirming the short-term bullish trend. Moreover, the MACD histogram is ticking bullishly higher, signaling a potential recovery in momentum.
That said, the MACD lines remain bearishly crossed, suggesting that short-term volatility could persist, while the RSI stays neutral, offering no clear directional bias. If BETR extends its correction phase, it could find strong confluence support at the golden ratio level around $38, where the 50-4H EMA also provides additional dynamic support — a zone from which a bullish rebound could easily occur.
- Check out our free forex signals
- Follow the top economic events on FX Leaders economic calendar
- Trade better, discover more Forex Trading Strategies
- Open a FREE Trading Account
- Read our latest reviews on: Avatrade, Exness, HFM and XM