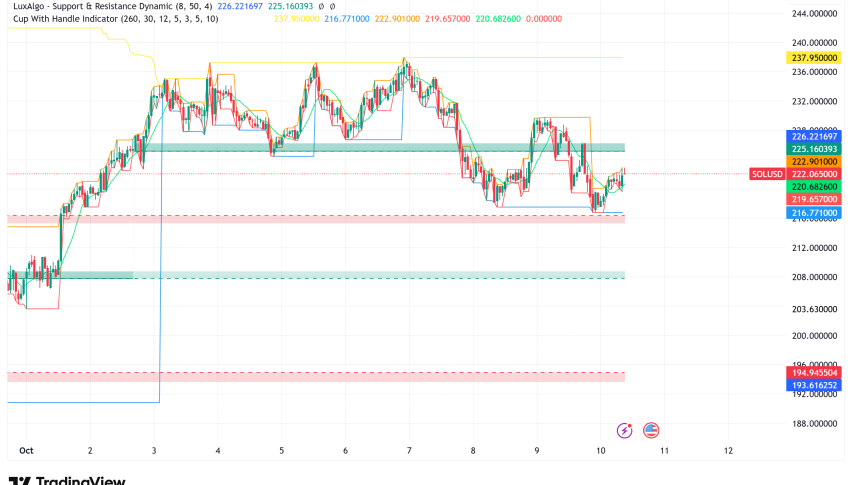
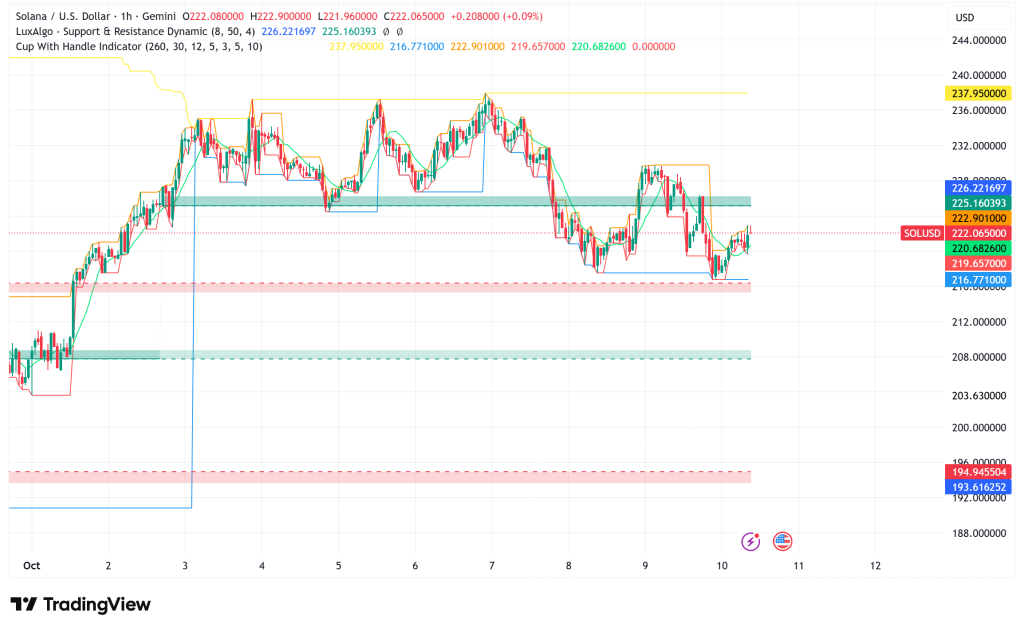
Solana Holds Above $222: Network Activity Plunges 50%, Technical Patterns Point to $425 Target
Solana is trading above $222, a drop of 1.8% in the last 24 hours. It is the fifth-largest cryptocurrency by market capitalization and is
Quick overview
- Solana is currently trading above $222, experiencing a 1.8% drop in the last 24 hours amidst mixed technical and fundamental indicators.
- Despite recent price gains, network activity has sharply declined by about 50%, raising concerns about the sustainability of SOL's rise.
- Technical analysis suggests a bullish cup and handle pattern with a potential price target of $425, but support levels around $210–$215 are critical for maintaining upward momentum.
- JPMorgan forecasts that Solana ETFs may generate $1.5 billion in their first year, significantly less than Bitcoin and Ethereum, due to investor fatigue and perceived lower importance.
Solana SOL/USD is trading above $222, a drop of 1.8% in the last 24 hours. It is the fifth-largest cryptocurrency by market capitalization and is dealing with a confusing mix of bullish technical settings and worrying fundamental indicators. Chart patterns point to a lot of upside potential, but onchain data shows a worrying divergence between price action and network usage. This has led to analysts being split on whether SOL’s recent gains are sustainable.
Alarming Divergence: Price Rises While Network Activity Collapses
Even though Solana’s pricing has been doing well lately, network activity has dropped sharply. The number of transactions that happen every day has dropped by about 50%, from about 125 million on July 24, 2025, to about 64 million now. This makes price momentum and fundamental network utilization go in opposite directions, which is usually seen as a hint of trouble in the crypto markets.
According to CryptoQuant analyst Crypto Onchain, a healthy rise in prices should be linked to more use of the ecosystem, such as DeFi activity, NFT transactions, and user transfers. The current difference shows that SOL’s rise may be more due to speculation than real demand. But the interpretation is still complicated because 80–90% of Solana’s transactions have historically been voting transactions that are necessary for network consensus. The main worry may be overblown if the drop is mostly due to changes in the voting system rather than fewer people using it.
Bullish Cup and Handle Pattern Targets $425
Even though there are some big worries, technical analysis shows a bright future. Lark Davis, a crypto expert, said that Solana’s monthly chart is showing a classic cup and handle pattern, which is usually linked to big bullish breakouts. If the pattern completes properly, the 1.618 Fibonacci extension level, which is close to $425, could be a price objective.
The monthly MACD indicator is making a golden cross, which is a strong sign that usually signifies the start of a long-term uptrend. This adds weight to the optimistic thesis. SOL is currently above important moving averages, such as the 50-day, 100-day, and 200-day MAs, which are all going up to show that the market is optimistic.
Critical Support Levels and Short-Term Outlook
After just breaking through $240, Solana is now in a consolidating phase. The 50-day moving average shows that the immediate support zone is between $210 and $215. If this level stays the same, it will show that buyers are still in charge and set the ground for another try at the $240-$250 resistance level. If the breakout goes well, it might lead to $280, where SOL had trouble in late 2024.
On the other hand, a clear break below $210 might lead to bigger corrections with possible targets at $190. Recent price movements showed good support around $200, where a fast drop turned around and long positions made more than 16% profits. Analysts are now looking at the $250 resistance level as the next big test for bulls.
JPMorgan Tempers ETF Expectations
Analysts at JPMorgan say that while speculation about Solana ETF clearance has made people more hopeful, they expect the results to be less impressive than those of Bitcoin and Ethereum funds. The investment bank thinks that Solana ETFs might bring in about $1.5 billion in their first year, which is a lot less than Bitcoin’s $36 billion and Ethereum’s $8.7 billion in their initial years.
JPMorgan says that two main worries are that investors are getting tired of crypto ETFs after so many have been out, and that Solana is seen as less important than Ethereum as the best smart contract platform. Also, crypto treasury businesses that give SOL exposure through shares could take money away from ETF products.
Solana Price Prediction and Investment Strategy
If Solana can stay over $210, it looks like it could go up based on its current technical structure. If the cup and handle pattern is completed successfully, prices could rise toward the $425 Fibonacci target in the next few months. But the 50% drop in network activity means that there is a lot of risk on the downside if the fundamentals stay weak.
Conservative traders should keep a close eye on the $210–$215 support zone and set stop-losses at breakeven to protect their profits. Investors who are more ambitious and want to see the price reach $425 should keep a watch on both the $250 breakout level and the ongoing network activity measures to make sure the rise will last. In the next few weeks, we’ll find out if Solana’s technical strength can make up for its fundamental divergence or if the drop in network activity means a correction is approaching.
- Check out our free forex signals
- Follow the top economic events on FX Leaders economic calendar
- Trade better, discover more Forex Trading Strategies
- Open a FREE Trading Account
- Read our latest reviews on: Avatrade, Exness, HFM and XM