WTI Oil Forecast: Can Crude Reclaim $60 After Tariff Showdown?
Oil markets started the week on a firmer note, with WTI up over 1% to $59.8 after plummeting to a 5 month low last Friday.
Quick overview
- Oil markets began the week positively, with WTI rising over 1% to $59.8 after a significant drop last Friday.
- President Trump's comments about wanting to help China eased trade war fears, improving market sentiment.
- The ongoing ceasefire between Israel and Hamas has reduced geopolitical risks, encouraging traders to explore upside potential.
- Analysts caution that energy markets remain sensitive to news, with key resistance levels at $61.12 and potential bearish scenarios if prices fail to break above.
Oil markets started the week on a firmer note, with WTI up over 1% to $59.8 after plummeting to a 5 month low last Friday. The bounce came after President Donald Trump said over the weekend the US wants to “help China, not hurt it” just days after threatening to impose 100% tariffs on Chinese goods starting November 1. His comments eased trade war fears and improved sentiment and demand outlook.
Meanwhile, the ceasefire between Israel and Hamas held for a 3rd day, reducing the geopolitical risk premium that had lifted prices earlier in the month. The combination of diplomatic calm and bargain hunting is encouraging traders to test the upside again, although volatility remains high.
Analysts warn energy markets are still sensitive to headlines. Any tariff escalation or disappointing demand data could reverse gains quickly, so traders should be on alert as oil hovers near key levels.
WTI Crude Oil Chart Check & Critical Levels
Technically, oil is still fighting a downtrend that started at the October high near $62.89. The bounce is running into resistance at $60.57-$61.12 which is the 50% and 61.8% Fibonacci retracement of the recent decline.
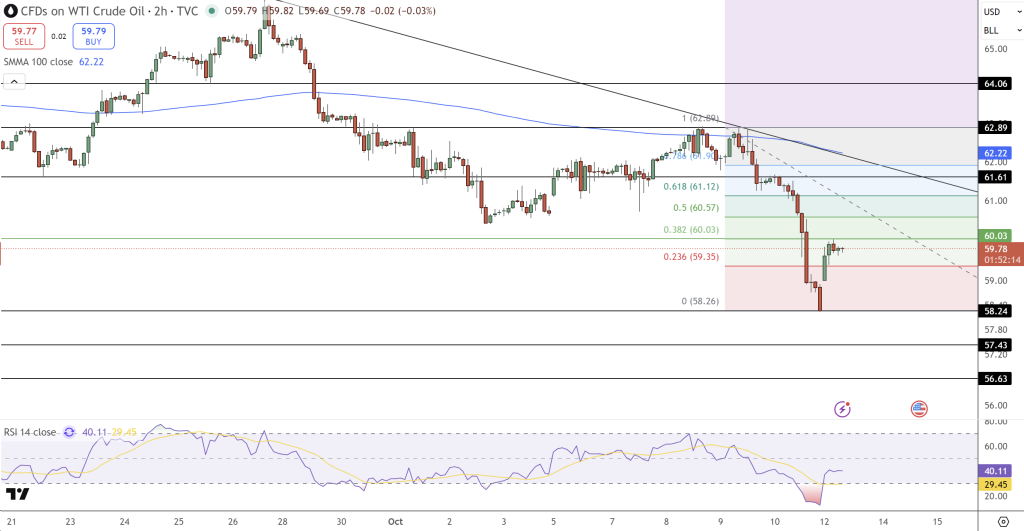
The 100 period SMMA is near $62.22 and is still sloping down, reinforcing the bearish bias. The 2 hour chart shows a clear sequence of lower highs and lower lows, sellers are in control. But the RSI near 40 has recovered from oversold levels and a bullish divergence is starting to form—where RSI is trending higher while price is flat—which is often a precursor to short term rallies.
WTI Crude Oil Trade Setup: Breakout or Rejection
WTI is at a technical crossroads, so watch how price behaves around $61.
- Bullish scenario: A confirmed break above $61.12 could take oil to $62.22-$62.89 where the next resistance and the 100-SMMA converge.
- Bearish scenario: Failure to clear $61.12 may see selling towards $58.24, then $57.43 and $56.63 if selling resumes.
Trade: Short below $59.30 to $58.20 or long above $61.20 to $62.80 with stop $59.20
- Check out our free forex signals
- Follow the top economic events on FX Leaders economic calendar
- Trade better, discover more Forex Trading Strategies
- Open a FREE Trading Account
- Read our latest reviews on: Avatrade, Exness, HFM and XM