Solana Trades Above $160 as Bulls Battle for Control Amid Mixed Market Signals
Solana (SOL) is still above $160 at the time of writing, up 1.3% in the last 24 hours. This is because the leading layer-1 blockchain is
Quick overview
- Solana (SOL) is currently trading above $160, showing a 1.3% increase in the last 24 hours amidst mixed technical and fundamental signals.
- The asset is near a key support zone, with analysts suggesting it may present a buying opportunity despite bearish indicators like a declining RSI and MACD.
- Demand metrics indicate a recovery, with a 2.73% increase in Open Interest and positive net inflows into Solana ETFs, suggesting growing interest from both retail and institutional investors.
- However, on-chain analytics reveal a concerning 30% drop in active users, raising questions about the sustainability of Solana's growth amid liquidity concerns.
Solana SOL/USD is still above $160 at the time of writing, up 1.3% in the last 24 hours. This is because the leading layer-1 blockchain is going through a very important technical point. Short-term price action shows strength, but the fundamentals are going in different directions, making it hard for traders to figure out where the asset is headed in the near future.
SOL/USD Technical Analysis: Accumulation Opportunity Below $160
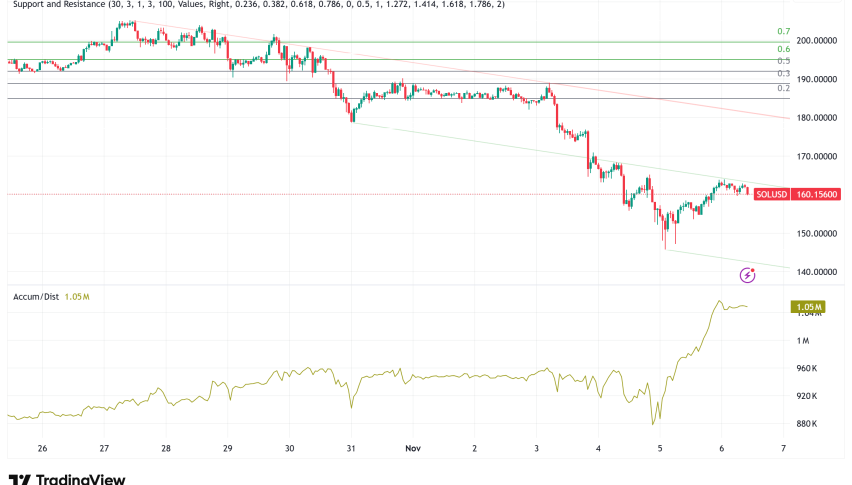
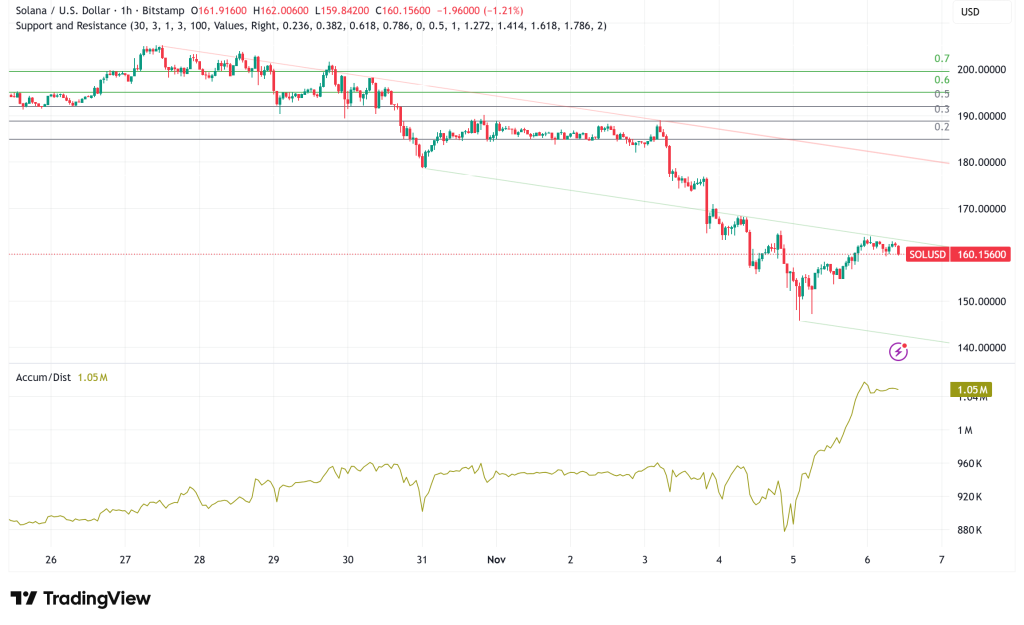
Solana has moved near the $160 support zone after breaking down from a descending triangle pattern. This level has historically been a launchpad for bullish reversals. Crypto VIP Signal says that this price range is a key accumulating place where strong-handed buyers have consistently shown interest in buying.
Many analysts think that the recent drop from $186, when SOL was turned down at the 200-day Exponential Moving Average, has put the asset in a good place to buy. But the technical picture is still quite shaky. The Relative Strength Index (RSI) is at 34, which is close to the oversold level. The Moving Average Convergence Divergence (MACD) is still heading down with its signal line, which means that both indicators indicate to a further bearish trend.
The 50-day EMA is falling and getting closer to the 100-day EMA, which is a hint of an oncoming death cross that usually confirms a short-term bearish trend. If prices can’t hold at their current levels, traders have put stop-losses just below the $150 psychological threshold, which is the next key support level.
Retail and Institutional Demand Show Signs of Recovery
Even though there are technological problems, demand measurements are showing a more positive picture. According to CoinGlass’s futures market data, Solana’s Open Interest has grown by 2.73% to $7.64 billion in the last 24 hours. This shows that more traders are getting involved and using leverage in the market.
The OI-weighted funding rate has turned positive to 0.0066%, which is a big change from the negative -0.0253% reading earlier in the day. This change shows that traders are more willing to pay extra to keep their long positions, which is a sign of optimistic mood. In support of this concept, short liquidations of $7.19 million have exceeded long liquidations of $4.73 million, getting rid of bearish positions that were too heavily leveraged.
On the institutional side, US spot Solana ETFs saw $9.70 million in net inflows on Wednesday, making it the sixth day in a row that flows were positive. This ongoing interest from institutions gives a strong base for possible price increases.
Solana Network Metrics Present Liquidity Concerns
Demand indicators look good, but on-chain analytics show some worrying patterns. In the third quarter of 2025, Solana’s active users dropped by 30%, which is a big drop in blockchain activity compared to earlier times. This mass departure of users makes us wonder if the network’s growth path is sustainable.
In the last day, the Total Value Locked (TVL) on Solana went up slightly by 2.27% to $10.215 billion. It had temporarily dropped below the $10 billion mark, which is a psychological level. But the bigger picture is still worrying, as the market value of stablecoins on the network fell 8.16% in the preceding week to $13.816 billion. This lack of liquidity could limit demand on-chain and limit the upside potential.
Ambitious Upgrade Plans Target Million-Transaction-Per-Second Speeds
Harmonic’s co-founder has said that they want to greatly increase Solana’s ability to handle transactions, reaching one million transactions per second. This big improvement will put Solana in direct competition with centralized exchanges in terms of throughput, which could spark new interest from developers and users in the ecosystem.
Solana Price Prediction: Critical Week Ahead for SOL
- Bull Case: If Solana stays above $155-$160 and demand from both retail and institutional investors keeps growing, SOL might challenge the $174-$177 supply zone again soon. If this level is successfully reclaimed, it would be possible to climb back toward the $186 resistance at the 200-day EMA. This scenario is supported by the good financing rates and ETF inflows, especially if the overall mood in the crypto market gets better.
- Bear Case: If the $155 support level is not held, selling would likely speed up toward $150, with the worst-case scenario aiming for the $126 level set by the June 22 low. This downside scenario is likely because of the drop in user activity, the drop in stablecoin liquidity, and the bearish technical signs. This is especially true if market conditions get worse.
- Most Likely Scenario: Solana looks like it will stay in the $150-$170 region for the next week as bulls and bears fight for control. The combination of good demand measurements and bad on-chain fundamentals makes for a tug-of-war that will probably end based on the trajectory of the larger market. Traders should keep a tight eye on the $155 level. If it breaks below that level, it would confirm a bearish continuation. If it stays above $160 with rising volume, it could mean that the market is starting to rebound.
- Check out our free forex signals
- Follow the top economic events on FX Leaders economic calendar
- Trade better, discover more Forex Trading Strategies
- Open a FREE Trading Account
- Read our latest reviews on: Avatrade, Exness, HFM and XM
Related Articles
Sidebar rates
Related Posts
