Ethereum’s Support Test at $3,400, Bearish Indicators Mount Despite Whale Accumulation
Ethereum is trading around $3,400 right now, which is a small 1.69% gain today. However, the second-largest cryptocurrency by market cap
Quick overview
- Ethereum is currently trading around $3,400, facing significant technical challenges and bearish signals.
- Bitcoin's dominance has increased to 60%, leading to a market environment where other cryptocurrencies struggle to gain traction.
- Despite whale accumulation indicating potential long-term confidence, technical indicators suggest a likely decline in ETH's price in the short term.
- Critical support levels are identified at $3,400, with potential drops to $2,800-$2,500 if bearish trends continue.
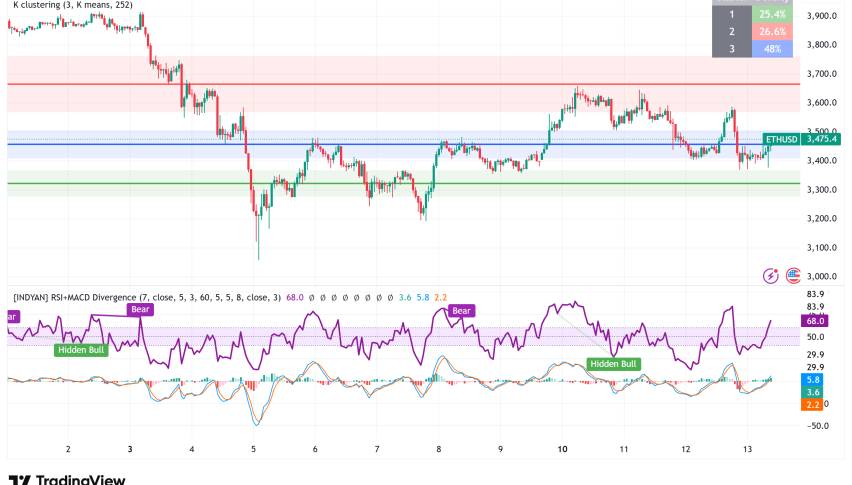
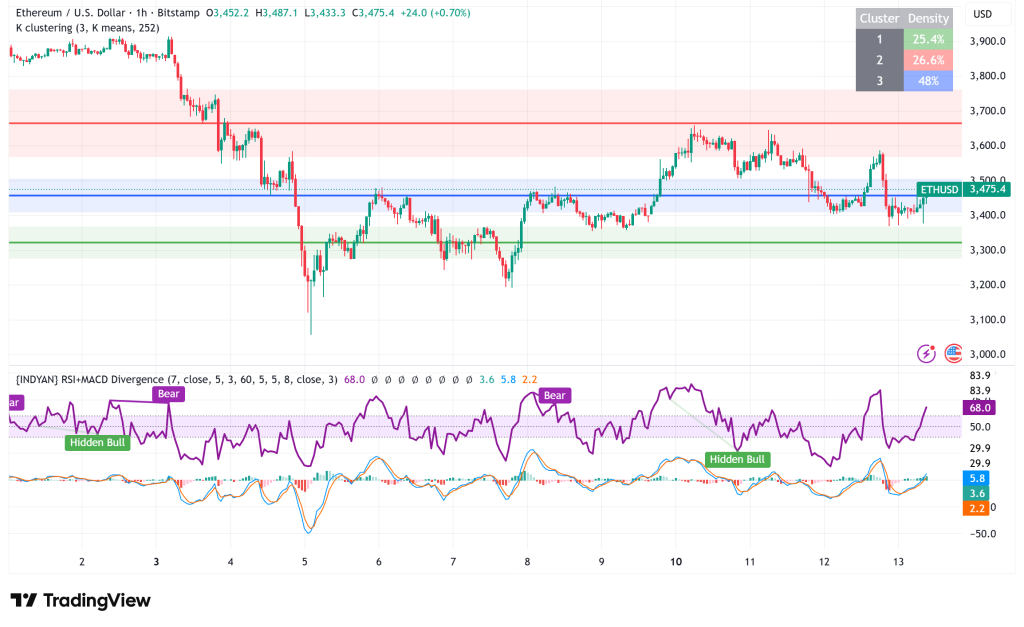
Ethereum ETH/USD is trading around $3,400 right now, mostly unchanged in the past 24 hours. However, the second-largest cryptocurrency by market capitalization is stuck in a technical vice grip. ETH opened at $3,415.80 and rose to $3,473 before falling back to a key support zone that has held up against deeper selloffs throughout 2025.
The bigger picture of the market puts even more pressure on it. Bitcoin’s dominance has risen to 60%, which traders call “Bitcoin Season.” This is when most of the money goes into Bitcoin BTC/USD and other cryptocurrencies have a hard time gaining traction. The Crypto Fear & Greed Index has dropped to 24 from 38 just a month ago, which shows that a lot of people in the market are worried. Bitcoin’s recent drop from $108,000 to below $102,000 has had an effect on the whole cryptocurrency ecosystem.
ETH/USD Technical Analysis: Multiple Bearish Signals Converge
The daily chart shows that Ethereum is stuck in a shrinking triangular shape, stuck between a descending resistance trendline from the $4,800 highs in October and an ascending support trendline that kept things stable for most of 2025. This compression usually comes before big moves, but the question is which way they will go.
A few important technical indicators are showing symptoms of trouble. The Relative Strength Index (RSI) stands at 41.46, which is firmly in bearish territory and shows that selling pressure is still strong. This reading implies that bears are still in charge, but there is opportunity for more decline. It is not yet oversold (below 30).
The Average Directional Index (ADX) value of 32.66 is more worrisome. This indicator shows how strong a trend is, no matter which way it’s going. Readings above 25 show that the trend is strong. The challenge for bulls is that this powerful trend is definitely negative, which means that the selling pressure is based on more than just taking profits.
The hourly chart reveals that ETH is trading below both the $3,500 mark and its 100-hour Simple Moving Average on shorter timeframes. A significant negative trendline has developed with resistance at $3,550, making it hard for any recovery attempt to get off the ground. The hourly MACD is getting stronger in bearish territory, and the RSI has dipped below 50, both of which show that the market is weak in the short term.
Critical Levels to Monitor
Resistance Zones:
- Immediate: $3,550-$3,600 (bearish trendline and hourly resistance)
- Strong: $3,800 (former support turned resistance)
- Major: $4,000 (psychological level and prediction market target)
Support Zones:
- Immediate: $3,360-$3,400 (current battle zone and 61.8% Fibonacci level)
- Strong: $2,800 (ascending trendline confluence)
- Major: $2,500 (extended support and psychological level)
One Silver Lining: Golden Cross Remains Intact
The one good thing for bulls is the structure of Ethereum’s Exponential Moving Average (EMA). The 50-day EMA is still above the 200-day EMA, which is what technicians call a “golden cross.” This is usually a positive long-term indication. But there are some big problems with this positive configuration.
First, ETH’s present price is below both moving averages, which means that it is weak in the near term even though the longer-term structure is theoretically optimistic. Second, the gap between these averages is getting smaller, which could mean that a “death cross” is forming, when the 50-day crosses below the 200-day. This is a very negative sign that often comes before a long-term slump.
ETH Whale Accumulation Tells a Different Story
Technical indications show that the market is going down, while on-chain data tells a very different story. During this time of low prices, big holders have been buying a lot of ETH, which suggests that smart investors perceive a chance to make money at these prices.
Blockchain statistics show that whales bought 1.64 million ETH in October alone, which is over $6.4 billion at current levels, even though the price went down by 7% that month. One whale has bought 385,718 ETH worth almost $1.33 billion since November 4. The most recent buy, 30,548 ETH worth $105.36 million, happened in the last hour. This whale borrowed almost $270 million via the decentralized lending site Aave to pay for their acquisitions, which shows that they are very confident in Ethereum’s medium-term future.
This pattern of buildup has happened before during recovery periods, as whales get ready for expected price rises. The fact that these holders are willing to use borrowed money shows that they expect prices to rise enough to cover the expenses of borrowing and the risks of price swings.
Ethereum Price Prediction: Bears Hold the Edge
Even though whales are buying up more and the Fusaka upgrade on December 3 promises better scalability, the technical evidence points to more downside in the short term.
A lot of different independent indications are pointing down, which doesn’t happen very often and makes it much more likely that the price will go lower. The Squeeze Momentum Indicator displays “bearish impulse,” which means that there will be a big decline, as what happened before Bitcoin dropped from $108,000. The Volume Profile Visible Range shows that ETH is trading below its point of control, which means that sellers are in charge and a lot of traders who bought higher are now losing money and want to sell.
The most likely course is to test and break through the $3,400 support level in the next few days. After that, the price will slowly move down to $2,800-$2,500, where the rising support trendline and 200-day EMA could eventually provide a floor. This might mean a drop of 19 to 28 percent from where we are now.
For bulls to prove this bearish scenario wrong, ETH needs to break well above the descending resistance trendline between $3,600 and $3,800. If that ceiling breaches with confidence, the way to $4,000 becomes clear. Myriad’s prediction markets offer ETH a 65% chance of hitting $4,000 before dropping to $2,500. However, a different market gives ETH a 79.1% chance of not reaching $5,000 by the end of the year, which is perhaps a more reasonable view given the current situation.
- Check out our free forex signals
- Follow the top economic events on FX Leaders economic calendar
- Trade better, discover more Forex Trading Strategies
- Open a FREE Trading Account
- Read our latest reviews on: Avatrade, Exness, HFM and XM