Oil Price Prediction: WTI Dips Below $59 as OPEC Glut Fears and US Supply Surge Hit Sentiment
Oil prices slipped further on Thursday, extending losses from the previous session after U.S. inventory data and OPEC’s latest forecast...

Quick overview
- Oil prices continued to decline, with WTI crude trading near $58.40 after U.S. inventory data raised concerns about a supply glut.
- U.S. crude inventories increased by 1.3 million barrels, indicating that supply is outpacing demand despite a drop in gasoline and distillate stockpiles.
- OPEC's latest report forecasts that global oil supplies will exceed demand by 2026, marking a shift from previous expectations of a deficit.
- Technical indicators suggest a bearish outlook for WTI, with immediate support levels at $57.70 and $56.80, while a recovery above $60.00 is needed for stabilization.
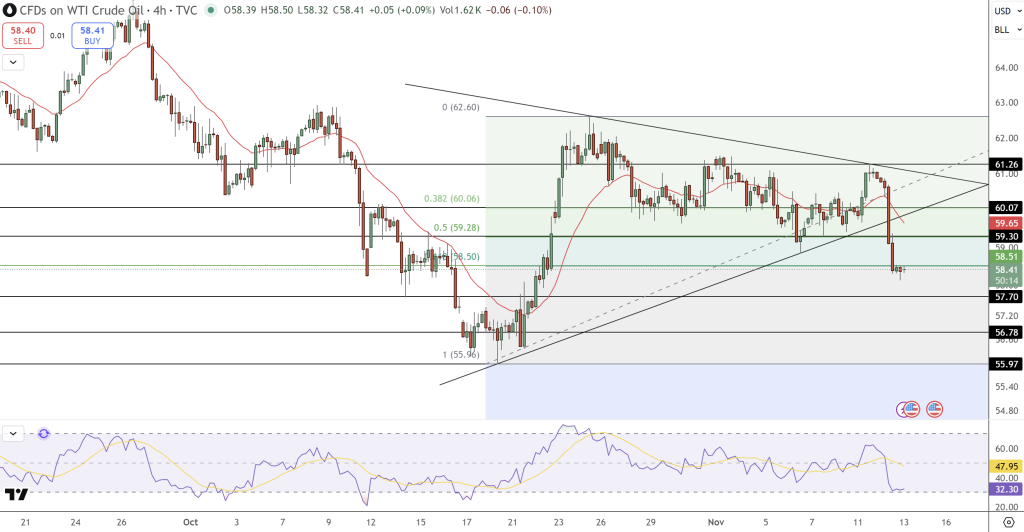
Oil prices slipped further on Thursday, extending losses from the previous session after U.S. inventory data and OPEC’s latest forecast fueled concerns of a potential supply glut. West Texas Intermediate (WTI) crude traded near $58.40, breaking below key support at $59.30- $60.00, underscoring growing bearish sentiment in the market.
Data from the American Petroleum Institute (API) showed that U.S. crude inventories rose by 1.3 million barrels last week, suggesting that supply continues to outpace demand. The drop in gasoline and distillate stockpiles wasn’t enough to offset the bearish impact of rising crude reserves.
Adding to the pressure, OPEC’s monthly report projected that global oil supplies would outstrip demand by 2026, shifting away from earlier expectations of a deficit. Analysts said the group’s more cautious outlook marks a significant departure from its previously bullish stance.
WTI Crude Oil (USOIL) Technical Outlook Turns Bearish
From a technical standpoint, WTI has decisively broken down from a symmetrical triangle pattern, signaling renewed downside momentum. The recent candle sequence resembles three black crows, a pattern that often confirms bearish continuation.
The 20-EMA has crossed below the 50-EMA, reinforcing the downtrend, while the RSI is near 32, suggesting oversold conditions but no sign of a reversal yet. Immediate support rests at $57.70, followed by $56.80, levels that coincide with key Fibonacci retracement zones.
If buyers manage to defend these levels, a brief rebound toward $59.30 is possible. However, the broader picture remains bearish unless prices reclaim $60.00, which would signal a potential stabilization.
WTI Crude Oil (USOIL) Traders Eye Deeper Pullback
For traders, the setup favors selling on rallies below $59.30, targeting $57.70 and $56.80, with stops above $60.50. The breakdown below the triangle pattern suggests that momentum remains in favor of sellers, particularly as macro data continues to point toward oversupply.
Until WTI reclaims the $60 threshold, the short-term outlook leans bearish, with risk skewed toward additional weakness as global inventories rise and market sentiment cools.
- Check out our free forex signals
- Follow the top economic events on FX Leaders economic calendar
- Trade better, discover more Forex Trading Strategies
- Open a FREE Trading Account
- Read our latest reviews on: Avatrade, Exness, HFM and XM
Related Articles


Sidebar rates
Related Posts
