Bitcoin Tests $90,000 as Futures Signal Deepening Market Stress
Traders are more worried than ever about Bitcoin's recent price movements. The cryptocurrency is having trouble holding the psychological
Quick overview
- Traders are increasingly concerned about Bitcoin's price, which is struggling to maintain the $90,000 support level after a 5.5% drop in 24 hours.
- Bitcoin's technical indicators have worsened, with resistance at $95,850 and immediate support at $90,800, suggesting potential further declines.
- The futures market has turned negative for the first time since March, indicating reduced demand and increased risk aversion among traders.
- Despite bearish signals, a potential reversal could occur if Bitcoin surpasses key resistance levels, particularly around $93,250-$93,800.
Traders are more worried than ever about Bitcoin’s recent price movements. BTC/USD is having trouble holding the psychological support level of $90,000, and it is currently trading around that level after dropping more than 5.5% in the last 24 hours. The weakening occurs at a time when there are a lot of adverse technical signs and the futures market has changed in a way that hasn’t happened since March.

BTC/USD Technical Breakdown Accelerates Below Key Moving Averages
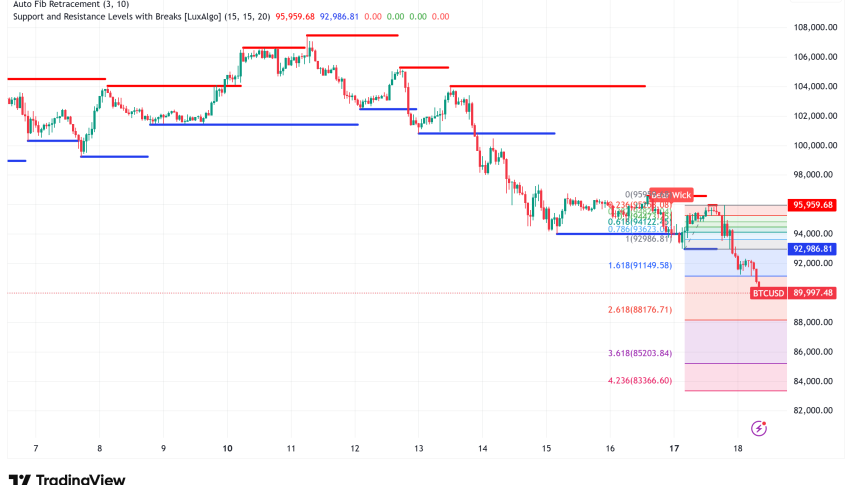
Bitcoin’s technical situation has gotten a lot worse because it couldn’t get back over $95,000. The cryptocurrency has dropped below its 100-hour simple moving average and set up a negative trend line. Resistance is currently around $95,850. BTC is trading below the important 23.6% Fibonacci retracement mark after hitting a low of $90,700, which means that the price is going down.
The immediate resistance zone is at $92,500, and the 50% Fibonacci level at $93,250 is the first big obstacle to any comeback attempt. A move above $93,800 would have to happen to change the momentum in the short term. This may lead to $94,500 and then $95,500. But the negative trend line and the fact that technical indicators are getting worse signal that bulls have a long way to go.
On the downside, immediate support is at $90,800, next big support is at $90,500, and finally, the important $90,000 level. If the price breaks below this zone, it might lead to faster selling toward $88,000, with the primary support level at $86,500. The hourly MACD is gaining strength in bearish territory, and the RSI has dipped below the neutral 50 mark, which confirms negative momentum. This is not a good sign.
Bitcoin Futures Market Flashes Rare Contrarian Signal
The most important thing that has happened is that Bitcoin’s futures-to-spot basis has turned negative for the first time since March. Futures contracts are currently trading below spot prices, which means there is no longer a premium that usually shows high leveraged demand. This move into “discount territory” shows that traders are aggressively lowering their risk and lowering the price of Bitcoin’s short-term outlook.
In the past, this pattern has been quite important. Since August 2023, every time the seven-day moving average has turned negative during bull phases, it has happened at the same time as bottom-formation ranges. This indication could be a key moment in the current cycle’s recovery if it hasn’t turned into a bear market yet. But the fact that same trend happened before a bigger drop in January 2022 makes things a little less definite.
The Bitcoin-USDT futures leverage ratio has gone down to about 0.3, which means that the high leverage from earlier quarters has calmed down a lot. This cleaner leverage structure lowers the risk of forced liquidation and could make any bullish reversal stronger, providing traders more room to take risks without the instability that was witnessed before.
BTC On-Chain Metrics Suggest Potential Reversal Setup
The Stablecoin Supply Ratio (SSR) RSI has dropped into buy signal zone after Bitcoin’s recent drop, adding to the mixed outlook. This indicator shows how Bitcoin’s market cap compares to the entire quantity of stablecoins. In other words, it shows how much “dry powder” is available in the crypto ecosystem. The rapid reduction means that there is a lot of buying power accessible compared to how much Bitcoin is worth right now.
Historical research shows that past SSR RSI buy signals have often happened at market bottoms or led to rallies that followed. However, many of these rallies only lasted for a short time and did not lead to long-term uptrends. In the meantime, Binance’s in-house flow data has shot up considerably over the normal range of 5 to 10, reaching levels not seen since the middle of 2025, when there was a lot of volatility. These kinds of increases are generally a sign of liquidity stress and more activity by big players when the market is unstable.
Bitcoin Price Outlook: Critical Juncture Ahead
Bitcoin is at a very important turning point. The combination of a negative futures basis, high exchange flows, and a break of important technical levels suggests that prices will keep going down in the near future. The $90,000 level is the last line of defense before losses could get worse and go down to $86,500-$88,000.
But there is a ray of promise in contrarian signs. The SSR buy signal and the large futures discount could mean that too much pessimism has made it possible for a bottom to form. Bitcoin has to get back over the negative trend line barrier around $95,850 and get back above $93,250-$93,800 for bulls to take back control.
The next few days will be very important in deciding if Bitcoin can hold its ground at present levels or if the search for a bottom will continue into the mid-$80,000 zone. As the first sign of restored confidence and a possible trend reversal, traders should look for the futures basis to rise over 0-0.5%.
- Check out our free forex signals
- Follow the top economic events on FX Leaders economic calendar
- Trade better, discover more Forex Trading Strategies
- Open a FREE Trading Account
- Read our latest reviews on: Avatrade, Exness, HFM and XM