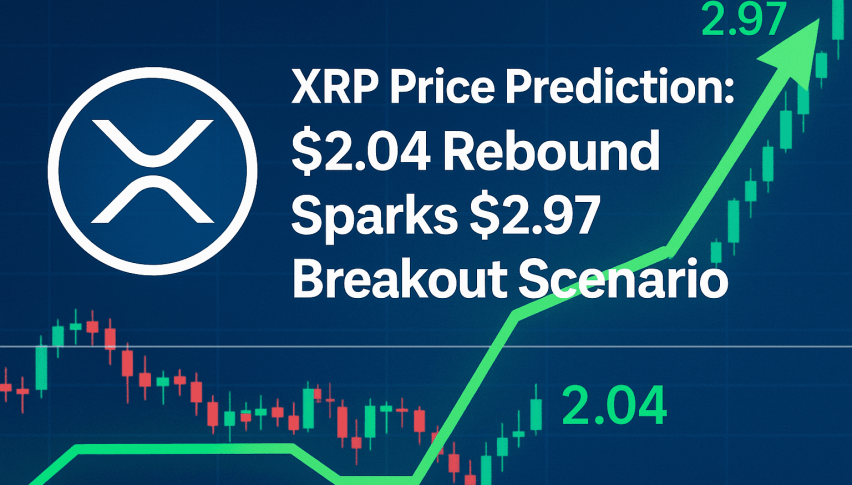
XRP Price Prediction: $2.04 Rebound Sparks a $2.97 Breakout Scenario
XRP price prediction turns bullish as XRP reclaims $2.04 and buyers defend $1.81 support, raising the odds of a breakout toward $2.50.
Quick overview
- XRP is stabilizing after a decline, currently trading at $2.04, up 5.18% in the last 24 hours.
- The asset's market cap is $123.1 billion, maintaining its position as the #4 cryptocurrency.
- Technical indicators show bullish signs, including a bullish engulfing pattern and a rising RSI from oversold levels.
- Traders should watch for a confirmed close above $2.06 to potentially target $2.30 and $2.50.
XRP is stabilizing after a sharp multi-week decline pushed the token into the $1.81–$1.90 support band, an area that has repeatedly triggered rebounds since early autumn. At $2.04 today, XRP is up 5.18% over the past 24 hours, supported by stronger buying interest and growing signs that sellers may be losing momentum.
The asset’s market cap now stands at $123.1 billion, keeping it firmly ranked #4 in the crypto market.
The latest 4-hour candle structure shows XRP breaking back above $2.00 with conviction. This recovery followed a deep rejection wick near the recent low — a classic signal that bears are exhausting and liquidity is shifting toward buyers.
Trendlines, Momentum, and Early Reversal Clues
XRP’s broader structure is still defined by a descending triangle, with each rally capped by a persistent downward trendline stretching back to September. Yet the tone is changing. The RSI has bounced sharply from oversold territory and is now forming the early stages of a bullish divergence, a pattern that often precedes meaningful trend reversals.
Candlestick behavior supports this shift. A bullish engulfing pattern formed at the base, coming after several long-wick candles that showed absorption of sell pressure.
XRP has also reclaimed the 20-EMA on the 4-hour chart for the first time in nearly two weeks. The next major technical barrier is the 200-EMA near $2.30, which aligns with the descending trendline.
Key short-term observations include:
• Bullish engulfing confirmation near support
• RSI turning higher from oversold levels
• Price reclaiming the 20-EMA for the first time in weeks
XRP/USD Analysis: What Traders Should Watch Next
If buyers can hold XRP/USD above $2.06, the recovery could extend toward $2.30 and later $2.50. A daily close above the descending trendline would mark the first genuine shift in structure and open the door to a broader breakout toward $2.70–$2.97.

A simple trade framework for newer traders is to wait for a confirmed close above $2.06, with a stop below $1.90. If momentum continues to build, XRP may revisit the $2.50 and $2.97 zones — levels that acted as major pivot points earlier in the cycle.
Despite recent volatility, the price action now reflects early signs of stabilization. If liquidity rotates back into altcoins, XRP could be among the first to regain upside traction.
- Check out our free forex signals
- Follow the top economic events on FX Leaders economic calendar
- Trade better, discover more Forex Trading Strategies
- Open a FREE Trading Account
- Read our latest reviews on: Avatrade, Exness, HFM and XM
Related Articles
Sidebar rates
Related Posts
