Alphabet (Google) Stock Skyrockets in 2025 Amid Tech Stock Market Crash

Quick overview
- Alphabet (Google) has surged over 118% since April, showing strong performance despite a broader tech sell-off.
- Technical indicators remain bullish, with golden EMA crossovers and positive MACD signals across multiple timeframes.
- However, bearish RSI divergences on daily and 4H charts suggest potential short-term corrections may be imminent.
- Key support levels to monitor include $278 on the 4H chart, $262.5 on the daily, and $243 on the weekly timeframe.
This year, Alphabet (Google) has delivered an impressive rally, climbing more than 118% from its April low and outperforming much of the tech sector. With investors piling back into AI-driven growth stories and Alphabet posting strong fundamentals, the question now is whether this momentum marks the start of a larger breakout—or if the stock is nearing a point where a healthy correction becomes likely.
Google Stock Remains Unshaken Despite the Broader Tech Sell-Off
Alphabet (Google) continues to demonstrate exceptional relative strength, posting a remarkable 118% rally since April—and doing so entirely unfazed by the sharp tech correction this month that dragged many high-growth names down 10–20%. Price action shows no sign of participating in the broader downturn; instead, Google has maintained its upward trajectory without meaningful retracement.
From a technical standpoint, the setup remains decisively bullish. The MACD lines are firmly crossed to the upside, supported by a strongly rising MACD histogram, reinforcing sustained momentum behind the move. In addition, the key EMAs are aligned in a bullish formation, confirming the long-term trend structure on higher timeframes.
While the RSI currently sits in overbought territory, it is not flashing any bearish divergence or reversal signals. In the context of a strong trend, overbought conditions often reflect persistent institutional buying rather than exhaustion.
Overall, Google’s chart shows continued dominance, trend integrity, and strong momentum—standing out as one of the few major tech names untouched by the recent sector-wide pullback.
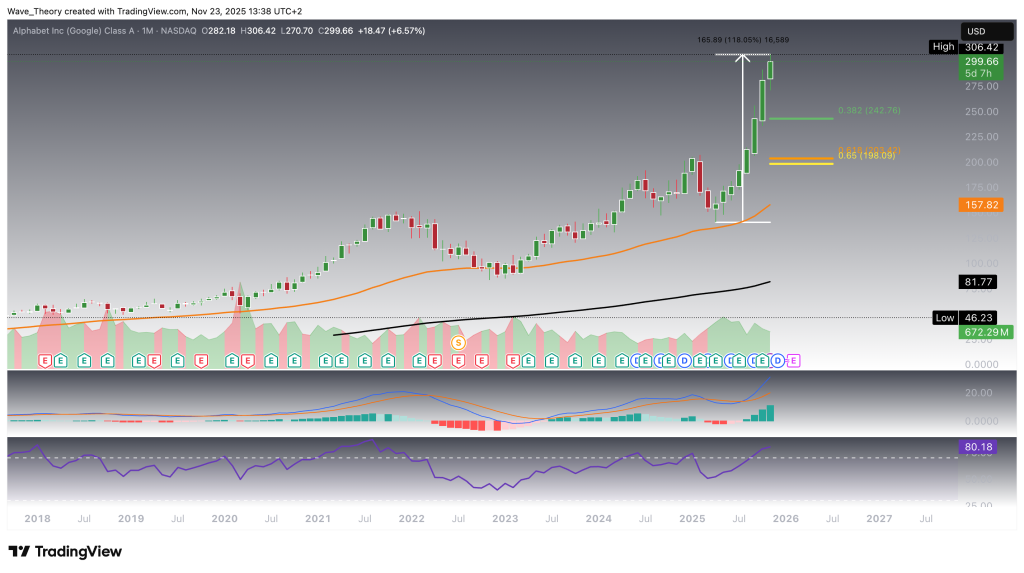
Google Stock Shows Bullish Strength on the Weekly Chart
On the weekly timeframe, Alphabet (Google) continues to exhibit strong trend structure. The EMAs remain in a golden crossover, confirming a sustained bullish bias in the mid-term and signaling that momentum remains firmly on the upside. In addition, the MACD lines are cleanly crossed to the upside, while the MACD histogram has begun ticking higher again this month, indicating renewed bullish acceleration.
The RSI is trading in overbought territory, which reflects strong trend momentum, but it also opens the door for a potential bearish divergence if price makes a new high while momentum does not. This is something traders should monitor closely.
If Google enters a corrective phase, the chart offers several well-defined support zones. The next significant Fibonacci retracement levels sit at $243 and $200, providing the first layers of structural support. Around $209, the 50-week EMA adds further confluence and may serve as a dynamic support level during any pullback. Should these areas fail, the broader long-term structure remains intact as long as Google stays above the 200-week EMA near $158, which represents the major cyclical support zone.
Overall, the weekly chart continues to lean decisively bullish, but it is approaching levels where a controlled pullback would be technically healthy.

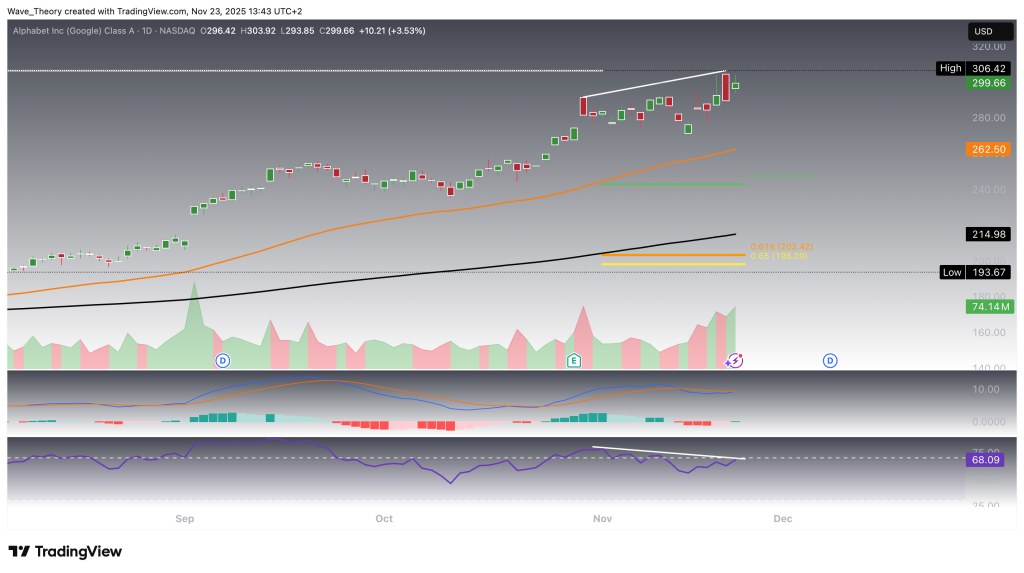
Bearish Divergence on the Daily RSI
On the daily chart, Google is beginning to show signs of momentum fatigue. The RSI is printing a clear bearish divergence, which introduces the possibility of a near-term correction as price continues making higher highs while momentum starts to lag. Should this divergence play out, Google could retrace toward the 50-day EMA around $262.5, or extend the pullback toward the 0.382 Fibonacci support near $243.
Despite this short-term warning signal, the broader technical picture remains constructive. The MACD lines are still crossed to the upside, and the MACD histogram has been ticking higher over the past several days, signaling ongoing bullish momentum. Additionally, the EMAs continue to hold a golden crossover, indicating a firmly intact trend structure.
Taken together, while the bearish RSI divergence suggests a possible short-term cooling phase, the overall trend remains bullishly confirmed in the short- to medium-term.
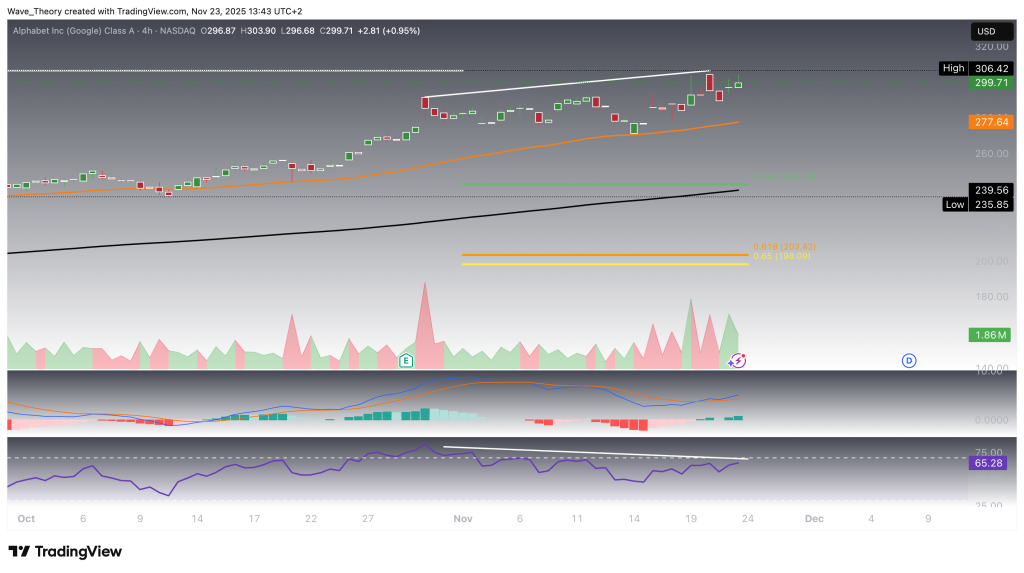
Similar Outlook on the 4H Chart
The 4H chart echoes the same structure seen on the daily timeframe. The RSI is forming a bearish divergence, signaling that upward momentum may be weakening even as price continues to push higher. In contrast, both the MACD and the EMAs are still generating bullish signals, underscoring that the underlying trend remains intact for now.
If Google enters a short-term pullback, the chart offers clearly defined support zones. The first major level sits at the 50-4H EMA around $278, a dynamic support area where price has bounced bullishly multiple times in recent sessions. Below that, the 200-4H EMA aligns with the 0.382 Fibonacci retracement near $243, creating a strong confluence zone of secondary support.
Overall, the 4H chart maintains a bullish structure but carries the same cautionary divergence seen on higher timeframes.
Summary: Key Technical Levels for Google Stock
Google continues to show exceptional strength across all major timeframes, having rallied 118% since April and remaining unaffected by the recent 10–20% tech-sector sell-off. The broader trend structure is decisively bullish, with golden EMA crossovers present on the weekly, daily, and 4H charts, alongside bullish MACD signals and rising histograms.
However, momentum indicators are flashing early warning signs. A strong bearish RSI divergence appears on both the daily and 4H charts, and the RSI on the weekly timeframe is overbought and at risk of forming a bearish divergence.
If a pullback develops, the most important support levels to watch are:
-
4H timeframe:
-
50-4H EMA at $278
-
200-4H EMA and 0.382 Fib at $243
-
-
Daily timeframe:
-
50-day EMA at $262.5
-
0.382 Fib at $243
-
-
Weekly timeframe:
-
Key Fib supports at $243 and $200
-
50-week EMA around $209
-
200-week EMA near $158 (major long-term support)
-
Despite potential short-term cooling, the trend remains bullishly aligned in the short- to medium-term as long as these support levels continue to hold.
- Check out our free forex signals
- Follow the top economic events on FX Leaders economic calendar
- Trade better, discover more Forex Trading Strategies
- Open a FREE Trading Account
- Read our latest reviews on: Avatrade, Exness, HFM and XM