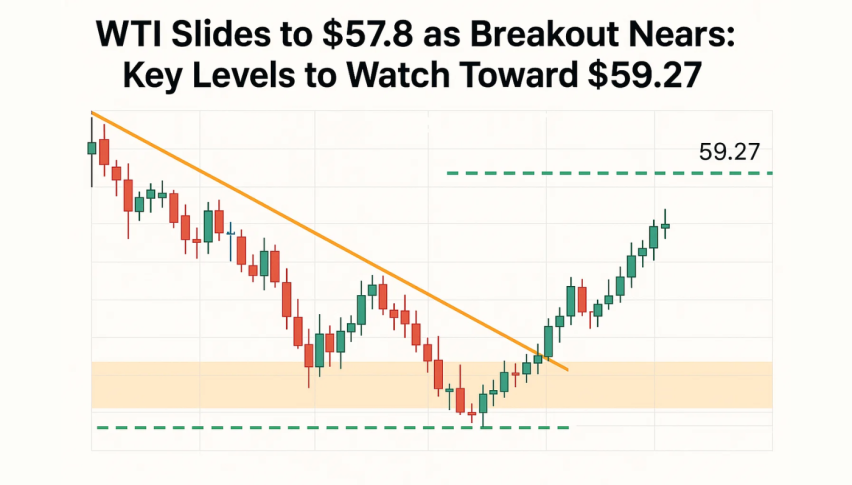
WTI Slides to $57.8 as Breakout Nears: Key Levels to Watch Toward $59.27
WTI crude oil futures slipped to $57.8 per barrel, marking a fourth straight decline and the lowest level in a month...
Quick overview
- WTI crude oil futures fell to $57.8 per barrel, marking a fourth consecutive decline and the lowest price in a month.
- The decline is influenced by potential progress in the Russia-Ukraine peace talks, which could alter global oil supply dynamics.
- Traders are cautious due to rising non-OPEC supply and sluggish global demand, with inventories expected to increase into next year.
- Technical analysis shows WTI is stabilizing around $58.00, but recent patterns indicate hesitation rather than a reversal.
WTI crude oil futures slipped to $57.8 per barrel, marking a fourth straight decline and the lowest level in a month. The drop comes as US and Ukrainian officials signaled progress toward a possible Russia-Ukraine peace framework, a scenario that could reshape global oil flows.
Some European allies worry the proposal may offer concessions to Moscow, but any breakthrough that leads to eased sanctions could bring more Russian supply into a market already expecting a surplus in 2025. WTI is down over 5% this month and is heading toward a fourth monthly loss, its longest losing streak since 2023.
Market Awaits Clarity on Supply Outlook
The peace signals come at a time when traders are already watching rising non-OPEC supply and a sluggish global demand backdrop. With inventories expected to build into next year, sentiment remains defensive until new data shows a tighter balance.
WTI Crude Oil: Technical Structure Tightens
On the chart, WTI is trying to stabilize around $58.00 after a sharp retreat toward the lower edge of a broad descending pattern. The market continues to print lower highs off the $60.85 resistance zone, keeping momentum tilted to the downside.
However, buyers are still defending the long-standing ascending trendline that extends from mid-October. The latest rebound from $57.40 came with multiple long-tailed candles, showing buyers absorbing sell pressure. But with price still below the 20-EMA, recent spinning tops and doji candles signal hesitation, not a reversal.
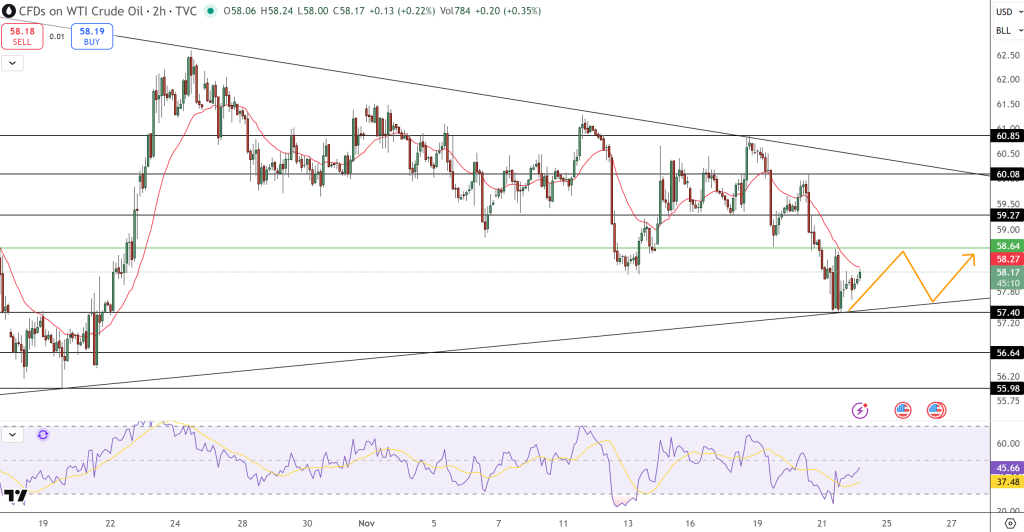
The RSI at 45 is recovering from oversold territory, but there’s no confirmed bullish divergence yet.
Key Levels to Watch
- Resistance: $58.64, $59.27, $60.08, $60.85
- Support: $57.40, $56.64, $55.98
Trade Setup: Wedge Bounce Strategy
- Bullish Case: A strong hold above $57.40 paired with a bullish engulfing candle or three white soldiers may lift WTI toward $58.64 and $59.27. Stop: below $57.20.
- Bearish Case: Failure at $58.64 with a shooting star or three black crows pattern could push oil back to $57.40, then $56.64. Stop: above $59.00.
WTI remains in a compression zone. The next clean breakout will likely define the direction of the next trend leg.
- Check out our free forex signals
- Follow the top economic events on FX Leaders economic calendar
- Trade better, discover more Forex Trading Strategies
- Open a FREE Trading Account
- Read our latest reviews on: Avatrade, Exness, HFM and XM