Will Japan Trigger a Global Liquidation Event? Financial Crisis Warning Signs
Quick overview
- Japan's recent interest rate hikes have negatively impacted global markets, particularly long-dated Japanese government bonds and assets linked to cheap yen funding.
- The 30-year JGB yield has surged dramatically since COVID, with a potential rise above 4.5% threatening systemic financial stress worldwide.
- The Japanese yen has depreciated by approximately 11.35% since April, indicating ongoing bearish pressure despite potential short-term support levels.
- Bitcoin has retraced about 36% recently, currently showing signs of a corrective bounce while facing key Fibonacci resistance levels.
Japan’s recent rise in interest rates has shaken global markets, hitting long-dated Japanese government bonds (JGBs) and assets tied to cheap yen funding hardest. For decades, Japan’s near-zero and negative rates fueled a massive carry trade, effectively supplying trillions in low-cost funding to global risk assets. As yields climb, long-duration holders, including domestic pension funds and insurers, face steep losses, while foreign investors unwind positions. The 30-year JGB, in particular, is now under pressure, and a rise to roughly 4.5–5% could trigger widespread liquidation. Such a move would dry up global liquidity, pressure equities and credit markets, and likely force central banks into emergency stimulus. While a rise below ~4% may cause pain, it could be manageable, but surpassing the 4.5% threshold risks systemic stress. This scenario underscores how intertwined Japan’s bond market is with global financial stability.
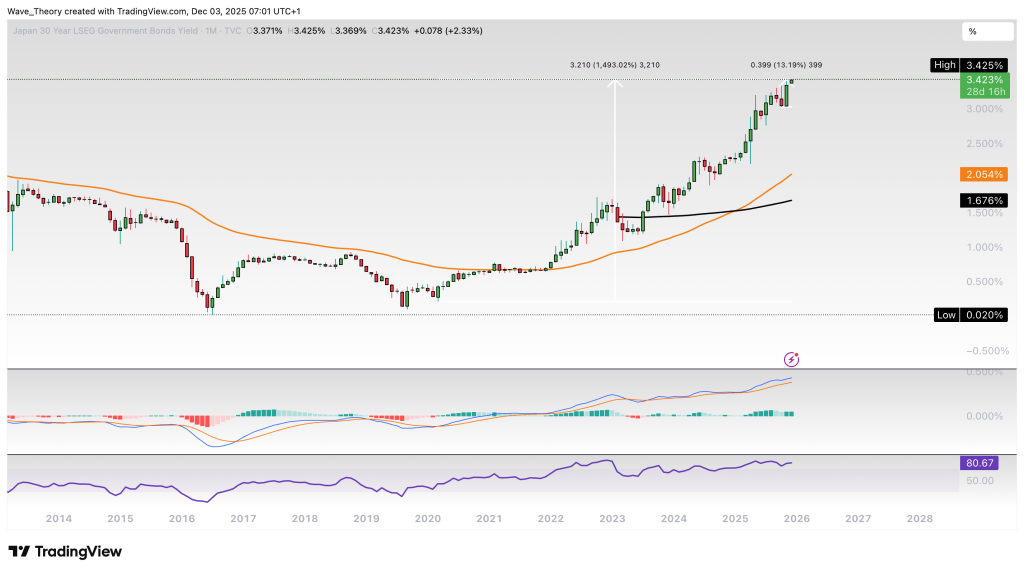
JP30Y Surged By 1,493 % Since Covid
Since March 2020, the JP30Y yield has skyrocketed by over 1,493%, underscoring a dramatic long-term bullish trend. In the past two months alone, the yield has advanced 13.2%, reflecting continued upward momentum.
On the long-term charts, the monthly EMAs have formed a golden cross, confirming the bullish trend. Momentum indicators further support this view: the MACD lines are bullishly crossed, with the MACD histogram trending higher since last month. The RSI remains in neutral territory, suggesting there is still room for further upside before the market enters overbought conditions.
Overall, JP30Y remains in a strong long-term uptrend, with technical indicators aligned for continued bullish pressure.
Why has JP30Y been rising since COVID?
-
COVID stimulus: BoJ and the government flooded the market with liquidity and huge bond purchases. Yields were ultra-low (sometimes even negative).
-
Inflation fears / global pressure: After 2021, inflation pressures globally started rising. Even Japan, historically low inflation, saw upward pressure on rates.
-
BoJ YCC adjustments: BoJ’s Yield Curve Control (YCC) tried to cap 10Y yields near 0%, but markets increasingly tested long-term yields, pushing the 30Y up.
-
Market repricing: Investors expect global rates (especially US yields) to stay higher; Japanese long-term bonds need to offer more to remain attractive.
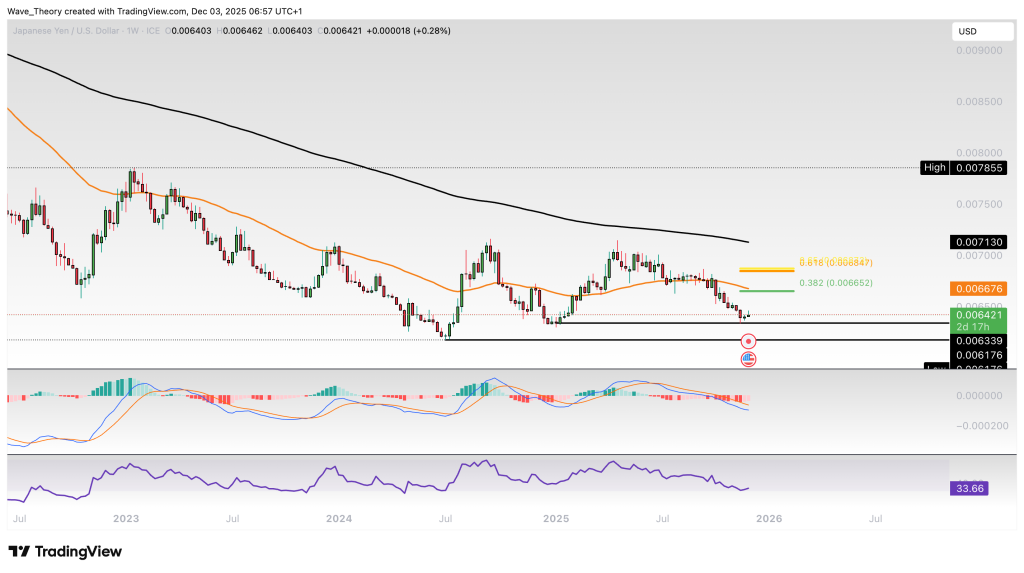
Japanese Yen Has Tanked 11,35 % Since April
The JPY/USD has declined sharply, losing approximately 11.35% since April, reflecting sustained bearish pressure over the past several months. The pair currently finds key support between $0.006176 and $0.00633, a zone where a potential bullish rebound could materialize. On the upside, the next significant Fibonacci resistances are located at $0.00665 and $0.0069, providing clear levels for potential profit-taking or reversal attempts.
From a momentum perspective, the MACD lines remain bearishly crossed, though the MACD histogram has been trending higher since last week, suggesting some short-term bullish divergence. The RSI is moving in neutral territory, indicating neither overbought nor oversold conditions at present.
Trend analysis on the weekly chart confirms the bearish medium-term structure, as the EMAs continue to display a death cross, reinforcing the ongoing downward trend. Overall, while the mid-term trend remains bearish, the current support zone could act as a pivot for a short-term corrective bounce.
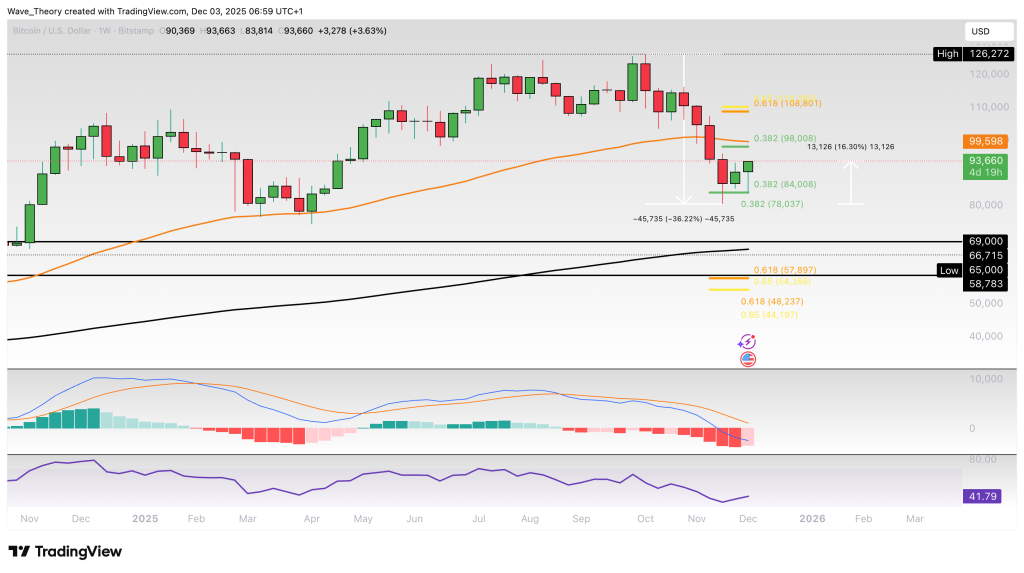
Bitcoin Has Dropped By Roughly 36 %
Over the last few weeks, Bitcoin has retraced approximately 36%, falling from around $126,300 to $80,000 USD. The pair currently appears to be bouncing off the 0.382 Fibonacci support zone between $78,000 and $84,000, having already surged roughly 16%. On the upside, the next significant Fibonacci resistances lie at $98,000 and $109,000, with a break above the golden ratio level at $109,000 required to invalidate the ongoing corrective phase.
The technical indicators present mixed signals. The MACD lines remain bearishly crossed, while the RSI sits in neutral territory, yet the MACD histogram is ticking higher this week, suggesting emerging bullish momentum. Additionally, the EMAs continue to display a golden cross, confirming the mid-term bullish trend.
Overall, Bitcoin is in a corrective bounce phase, with key Fibonacci levels and EMA structure providing guidance for the next potential move.
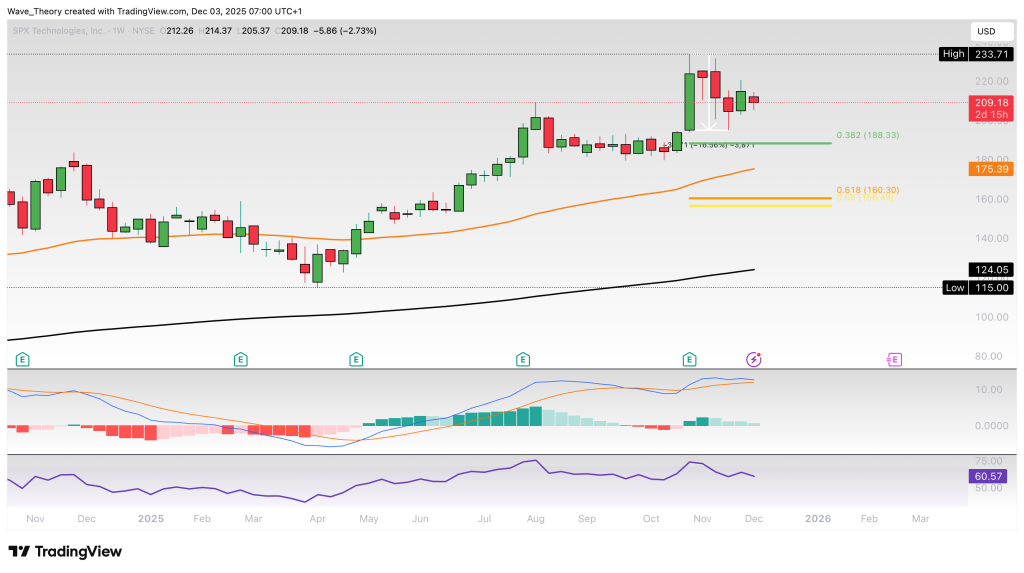
US Tech Sector Technical Overview
Over the last six weeks, the US tech sector has retraced roughly 17%, reflecting short-term bearish pressure. The sector currently finds key Fibonacci support levels at approximately $188 and $160, with the 50-week EMA providing additional support at $175.
From a trend perspective, the weekly EMAs and MACD lines remain bullishly crossed, confirming the mid-term uptrend. However, the MACD histogram has been ticking lower over the past four weeks, signaling weakening momentum, while the RSI remains in neutral territory.
Overall, despite recent short-term weakness, the sector retains its mid-term bullish structure, with Fibonacci levels and EMA support acting as potential pivot points for a rebound.
Closing Thoughts
Japan’s government debt is massive — over 235 % of GDP, with trillions of dollars in Japanese Government Bonds (JGBs) mostly held domestically. The Bank of Japan’s long-term support of bond prices has kept yields very low, encouraging global investors to borrow cheap yen and invest abroad (the “yen carry trade”). If Japanese yields rise, it forces domestic and foreign investors to repatriate capital or sell foreign assets to cover losses. This reduces global money supply and liquidity, making borrowing costlier worldwide. Higher yields also pressure stock markets, as investors rotate out of equities into safer bonds and financing costs for companies rise. Emerging markets and leveraged borrowers are particularly vulnerable. In short, rising Japanese interest rates can tighten global credit, reduce liquidity, and push stock prices down globally, acting as a multiplier of financial stress.
- Check out our free forex signals
- Follow the top economic events on FX Leaders economic calendar
- Trade better, discover more Forex Trading Strategies
- Open a FREE Trading Account
- Read our latest reviews on: Avatrade, Exness, HFM and XM
Related Articles


Sidebar rates
Related Posts
