Silver Price Forecast: $70.70 in Sight After $68.98 Breakout Shakes Bears
Silver prices are ending the week on firm footing, with XAG/USD trading near $68.98 after decisively breaking above a long-watched...

Quick overview
- Silver prices are showing strong momentum, trading near $68.98 after breaking above a key resistance zone.
- The breakout above the $66.90–$67.00 area has shifted sentiment positively, turning former resistance into support.
- Technical indicators, including candlestick patterns and moving averages, confirm the bullish trend, with key support levels at $67.00 and $65.80.
- Traders are targeting higher levels at $69.45 and $70.70, with pullbacks expected to be corrective rather than trend-reversing.
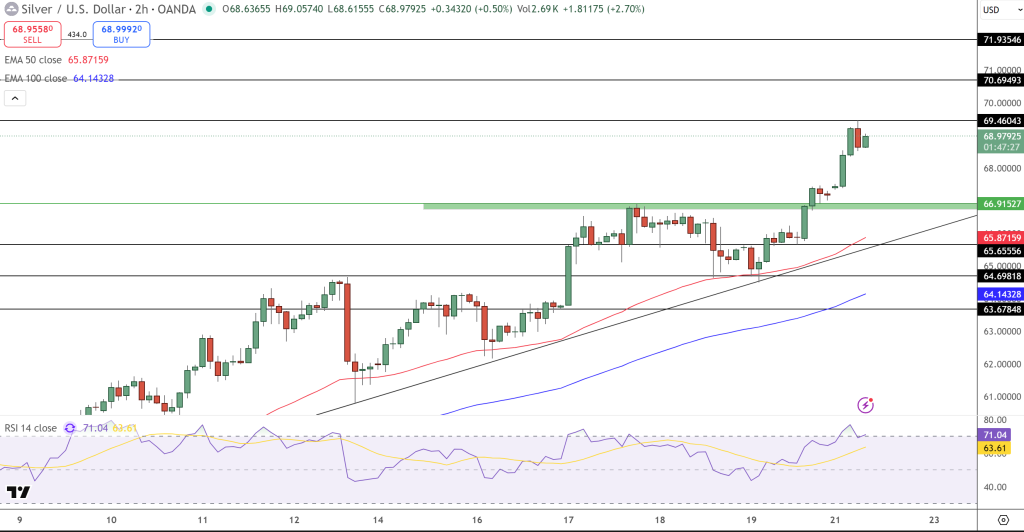
Silver prices are ending the week on firm footing, with XAG/USD trading near $68.98 after decisively breaking above a long-watched resistance band. The move has shifted short-term sentiment and put fresh upside levels back on traders’ radar as momentum builds into the new week.
Silver Breaks Key Resistance Zone
The breakout above the $66.90–$67.00 area marks an important technical development. That zone capped price action multiple times earlier this month, but once cleared, buyers stepped in with conviction. What matters now is that former resistance has turned into support, a classic sign of trend continuation rather than a one-off spike.
Silver remains comfortably inside a rising price channel that’s been intact since early December. Higher highs and higher lows continue to define the structure, keeping the broader bias tilted to the upside.
Candlesticks and EMAs Confirm Momentum
Candlestick behaviour reinforces the bullish case. The initial breakout candle showed a wide bullish body, followed by smaller consolidation candles near the highs. That pattern often reflects absorption of supply rather than aggressive profit-taking.
From a trend-following perspective, silver is holding well above its key moving averages:
- 50-EMA near $65.87, acting as dynamic support
- 100-EMA around $64.14, anchoring the broader trend
As long as price remains above these levels, pullbacks are likely to be corrective rather than trend-breaking.
Fibonacci Levels and RSI Outlook
Fibonacci extensions drawn from the latest pullback show that silver has already tagged the $68.15 level. The next technical objectives sit at $69.45, followed by $70.70, which also aligns with a psychological round number.
Momentum indicators remain supportive. The RSI near 71 reflects strong buying pressure, though it also suggests short-term cooling phases are possible. Importantly, there’s no bearish divergence yet, meaning momentum hasn’t rolled over.
What Traders Are Watching Next
Going into the week ahead, silver’s outlook hinges on whether buyers defend the newly formed support zone.
Key levels to watch:
- Support: $67.00, then $65.80
- Resistance: $69.45 and $70.70
Trade setup: Buy pullbacks toward $67.00, targeting $69.45–$70.70, with invalidation below $65.80.
With structure intact and momentum still favoring the upside, silver’s latest breakout looks more like a continuation move than a short-lived surge.
- Check out our free forex signals
- Follow the top economic events on FX Leaders economic calendar
- Trade better, discover more Forex Trading Strategies
- Open a FREE Trading Account
- Read our latest reviews on: Avatrade, Exness, HFM and XM