btc-usd
Forex Signals Dec 23: Canada, US GDP, and BHP, Korea Electric Power Earnings Preview
Today’s US and Canadian GDP data as well as BHP, Korea Electric Power, and Hyperliquid Strategies earnings highlight a mix of global...
•
Last updated: Tuesday, December 23, 2025

Quick overview
- US GDP is projected to grow at 3.4% q/q, driven by technology investment despite a lagging labor market, indicating a potential 'jobless growth' cycle.
- Canadian GDP may outperform expectations, providing short-term support to the Canadian dollar amid ongoing tariff-related risks.
- Earnings reports from BHP, Korea Electric Power, and Hyperliquid Strategies will offer insights into global economic health and sector positioning.
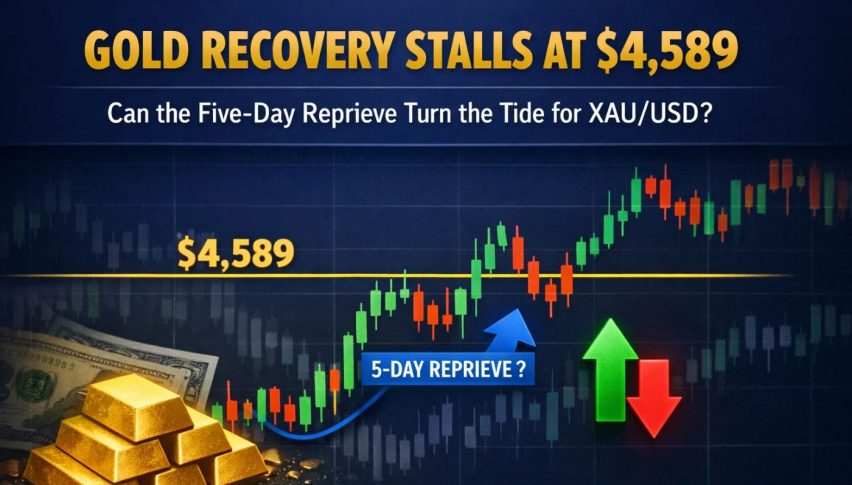
- Gold prices have fluctuated significantly, recently finding support after a drop from record highs, while Bitcoin and Ethereum continue to test key support levels.
Live BTC/USD Chart
BTC/USD

0.0000
MARKETS TREND
Today’s US and Canadian GDP data as well as BHP, Korea Electric Power, and Hyperliquid Strategies earnings highlight a mix of global heavyweights and niche players.
Key Market Events to Watch Today:
US GDP: Growth Without Labor Momentum
US GDP is expected to remain firm, driven largely by technology investment and capital expenditure, even as the labor market continues to lag. This divergence points to a developing “jobless growth” cycle, where output expands but employment fails to keep pace.
Preliminary US GDP is expected near 3.4% q/q. While government shutdown risks linger, the scale of private-sector investment—especially in AI and automation—may offset near-term fiscal drag.
Market Impact: US Dollar
A stronger GDP print could support the US dollar in the short term. However, seasonal trends typically favor a softer dollar into December and January, potentially limiting sustained upside.
Canada GDP: Signs of Stabilization
Canadian GDP may outperform the -0.2% m/m forecast, offering short-term support to the Canadian dollar. While tariff-related risks persist, much of the downside appears priced in, and thin holiday liquidity should cap market reactions.
Earnings Calendar – Today
Today’s earnings slate spans resource-heavy blue chips, state-backed utilities, and emerging strategy-focused firms, offering a broad snapshot of global economic health. Investors will be watching closely for guidance, margin trends, and demand signals that could influence sector positioning in the weeks ahead.
BHP Group Limited (BHP)
- Market Capitalization: ~$151.1 billion
- Reporting Period: September 2025
- Sector: Mining & Natural Resources
Key Focus Areas:
- Iron ore and copper pricing trends
- Capital expenditure discipline and dividend outlook
- Impact of China demand and global industrial activity
Why It Matters:
BHP is a bellwether for global commodity demand and economic momentum.
Korea Electric Power Corporation (KEP)
- Market Capitalization: ~$21.7 billion
- Reporting Period: September 2025
- EPS Estimate: $2.08
- Sector: Utilities
Key Focus Areas:
- Power pricing reforms and fuel cost management
- Government policy support and tariff adjustments
- Balance sheet repair following prior margin pressures
Why It Matters:
Results will signal whether profitability recovery in regulated utilities is gaining traction.
Hyperliquid Strategies Inc (PURR)
- Market Capitalization: ~$433.2 million
- Reporting Period: September 2025
- Sector: Alternative / Digital Strategies
Key Focus Areas:
- Revenue growth and strategy performance
- Market volatility impact on asset flows
- Expense control and scalability
Why It Matters:
Smaller-cap results often provide early signals on risk appetite and alternative investment demand.
Gold Prints New Record
Although demand for safe haven assets is still high, gold fell precipitously from record highs following the Fed’s most recent rate cut comments, as profit-taking was prompted by Powell’s cautious tone. Earlier this month, gold jumped above $4.3800 following the Federal Reserve’s announcement of a 25 basis point rate decrease. But the impetus soon waned, and prices dropped back to $4,004. The 20 daily SMA (gray) held as support last week and buyers returned and pushed XAU above $4,440K yesterday.
USD/JPY Returns Lower After the FOMC
Foreign exchange markets saw sharp swings. Early in the week, U.S. yield differentials and Japanese capital outflows pushed the dollar above ¥150, but disappointing U.S. jobs data triggered profit-taking, causing the USD/JPY to slide by four yen from its peak. However, the new BOJ governor the JPY has weakened and USD/JPY soared to 154 and we decided to close our buy signal for more than 80 pips as the pair found support at the 20 daily SMA (gray) and has rebounded more than 200 pips off that MA but reversed after the 25 bps rate cut from the FED.
USD/JPY – Daily Chart
Cryptocurrency Update
Bitcoin Still Testing the 100 Weekly SMA
Cryptocurrencies remained highly active over the summer. Bitcoin (BTC) climbed to fresh highs of $123,000 and $124,000 in July and August, supported by institutional inflows and technical strength. However, remarks from Treasury Secretary Scott Bessent ruling out U.S. increases to BTC reserves triggered a steep pullback, sending the coin down below $105,000 before finding support at the 200 daily SMA (purple) and recovering above $115,000 but then fell toward $100K again. However BTC remains supported by the 100 weekly SMA (green) and only a break below that would risk further losses.
BTC/USD – Weekly Chart
Ethereum Faces the 50 Daily SMA
Ethereum (ETH) has been similarly strong, surging toward $4,800, its highest since 2021 and near its all-time peak of $4,860. Despite a dip last week, ETH found support at the 20-day SMA, with retail enthusiasm and renewed institutional participation driving fresh upside momentum. Last week we saw a dive below $2.700 but the 200 weekly SMA held as support and we’re seeing a rebound but buyers face the 50 SMA (yellow) now. ETH/USD – Weekly Chart
- Check out our free forex signals
- Follow the top economic events on FX Leaders economic calendar
- Trade better, discover more Forex Trading Strategies
- Open a FREE Trading Account
- Read our latest reviews on: Avatrade, Exness, HFM and XM
ABOUT THE AUTHOR
See More
Skerdian Meta
Lead Analyst
Skerdian Meta Lead Analyst.
Skerdian is a professional Forex trader and a market analyst. He has been actively engaged in market analysis for the past 11 years. Before becoming our head analyst, Skerdian served as a trader and market analyst in Saxo Bank's local branch, Aksioner. Skerdian specialized in experimenting with developing models and hands-on trading. Skerdian has a masters degree in finance and investment.
Related Articles


Sidebar rates
Related Posts
