Silver Prices Up 620% Since COVID: A Historic Precious Metals Rally
Quick overview
- Silver has surged 620% since its 2020 low, reaching $83.75 before entering a corrective phase.
- Despite a recent 16.31% decline, the overall bullish trend remains intact with strong technical support levels.
- Key resistance levels are identified at $75.30 and $79.00, while immediate support is at $71.80.
- Current momentum indicators present a mixed outlook, with the MACD histogram improving but the RSI remaining neutral.
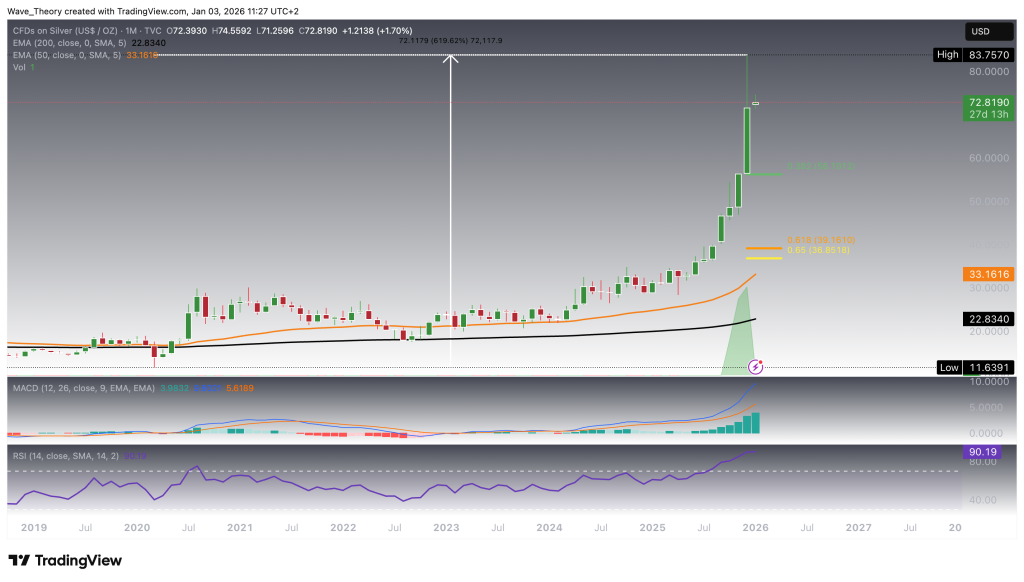
Silver has surged an extraordinary 620% from its 2020 low, with the majority of this explosive move unfolding over the past few months as prices turned parabolic.
Silver Price Reaches $83.75 — Bullish Trend Structure Remains Intact
Silver recently advanced to $83.75 before entering a corrective phase. Despite this pullback, the broader technical structure remains firmly bullish.
Momentum indicators continue to support the prevailing uptrend. The MACD lines remain bullishly crossed, while the MACD histogram is trending decisively higher, signaling sustained positive momentum rather than trend exhaustion. At the same time, the Relative Strength Index (RSI) is positioned in overbought territory, yet fails to generate any meaningful bearish divergence or downside signal, suggesting that elevated momentum remains justified within the current trend regime.
Trend-following indicators further reinforce this constructive outlook. The exponential moving averages (EMAs) have completed a golden crossover, a development that confirms the bullish trend on a long-term basis and underscores the strength of the underlying market structure.
In summary, while short-term consolidation is unfolding following the move to $83.75, momentum, trend, and structure indicators remain aligned to the upside, keeping the broader bullish bias firmly intact.
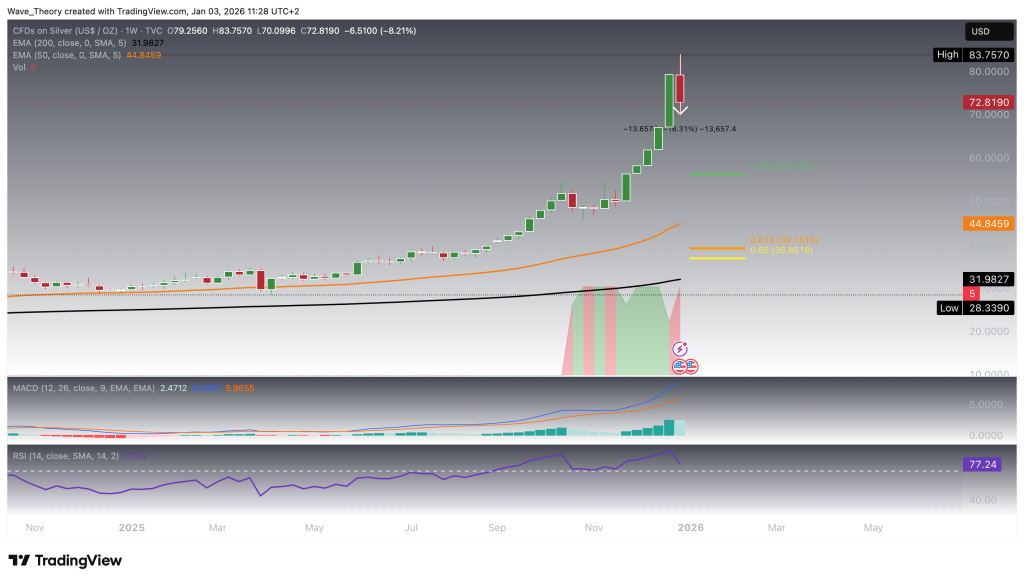
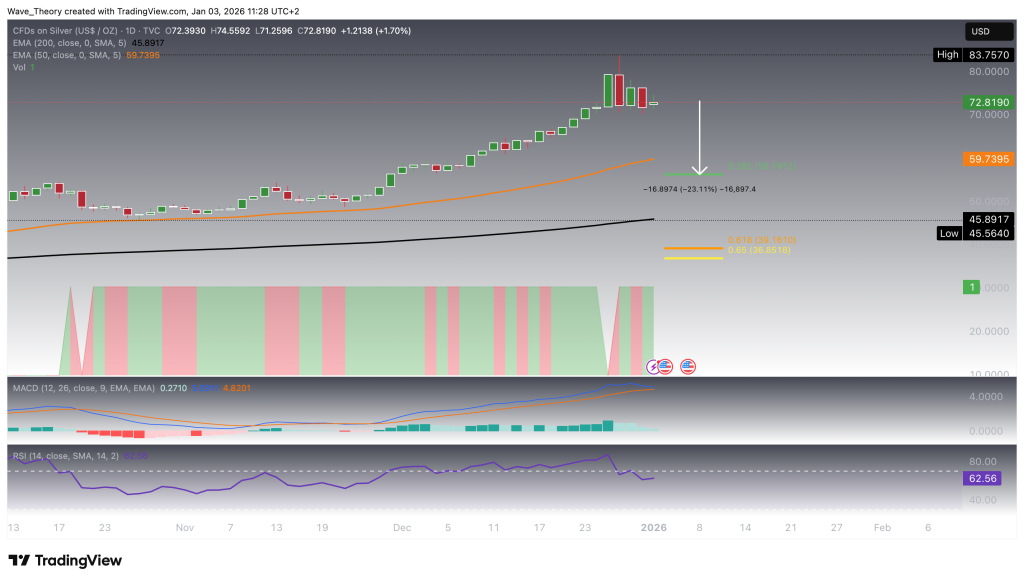
Silver Price Has Already Corrected by 16.31%
Silver has already entered a corrective phase this month, declining by 16.31% over the past few sessions. In response, the MACD histogram has begun to tick bearishly lower this week, indicating short-term momentum cooling, even though the MACD lines remain bullishly crossed, preserving the broader trend structure.
At the same time, the Relative Strength Index (RSI) is resetting from previously strongly overbought conditions and is now moving back toward neutral territory, alleviating prior momentum excesses. Meanwhile, the exponential moving averages (EMAs) continue to exhibit a golden crossover, which confirms the bullish trend on a mid-term basis.
Should the corrective move extend further, silver could retrace toward the 0.382 Fibonacci support near $56 or, in a deeper pullback scenario, toward the Golden Ratio support around $37. As long as silver holds above the Golden Ratio level at $37, the broader uptrend remains structurally intact.
Additional dynamic support is provided by the 50-week EMA at $44.85, while the 200-week EMA near $32 represents a major long-term support level.
Overall, despite the ongoing correction, the prevailing bullish market structure remains intact, with multiple technical supports positioned below current price levels.
Is a 23% Downside Correction Likely?
A corrective move toward the 0.382 Fibonacci retracement near $56 would imply downside potential of approximately 23% from current levels. However, the downside appears well-buffered by multiple layers of technical support before that level is reached.
Most notably, the 50-day EMA at $59.74 is already acting as a significant dynamic support zone. Below that, the 200-day EMA near $46 represents an additional and structurally important support level, reinforcing the broader bullish framework.
From a momentum perspective, the MACD histogram has been ticking bearishly lower over recent sessions, reflecting short-term cooling momentum. Importantly, however, both the MACD lines and the EMAs remain bullishly crossed, indicating that the prevailing trend remains bullishly confirmed across the short- to medium-term timeframe.
Meanwhile, the Relative Strength Index (RSI) has reset from overbought conditions back into neutral territory, providing neither bullish nor bearish signals at this stage. This reset alleviates prior momentum excesses without damaging the underlying trend structure.
In summary, while a deeper correction toward the 0.382 Fibonacci level cannot be ruled out, current indicator alignment suggests that the broader bullish trend remains intact, with multiple technical supports likely to absorb downside pressure before a 23% decline materializes.
Immediate Support and Resistance Levels for Silver
On the upside, silver faces its next major resistance levels at approximately $75.30 and $79.00. To the downside, price is currently holding at the 50-period EMA on the 4-hour chart, located around $71.80, which is acting as immediate dynamic support.
Should silver break below this level on a bearish continuation, the next significant support zone lies at the 200-period EMA on the 4-hour timeframe, implying potential downside of roughly 14% from current levels.
Despite this near-term vulnerability, the exponential moving averages on the 4-hour chart remain bullishly crossed, confirming that the short-term trend structure is still bullish. Momentum indicators present a mixed picture: the RSI is positioned in neutral territory, offering no directional bias, while the MACD lines are bearishly crossed. However, the MACD histogram is currently ticking bullishly higher, suggesting that bearish momentum may be losing strength.
In summary, while silver is consolidating below resistance and testing short-term support, the broader short-term trend remains constructive, provided key EMA supports continue to hold.
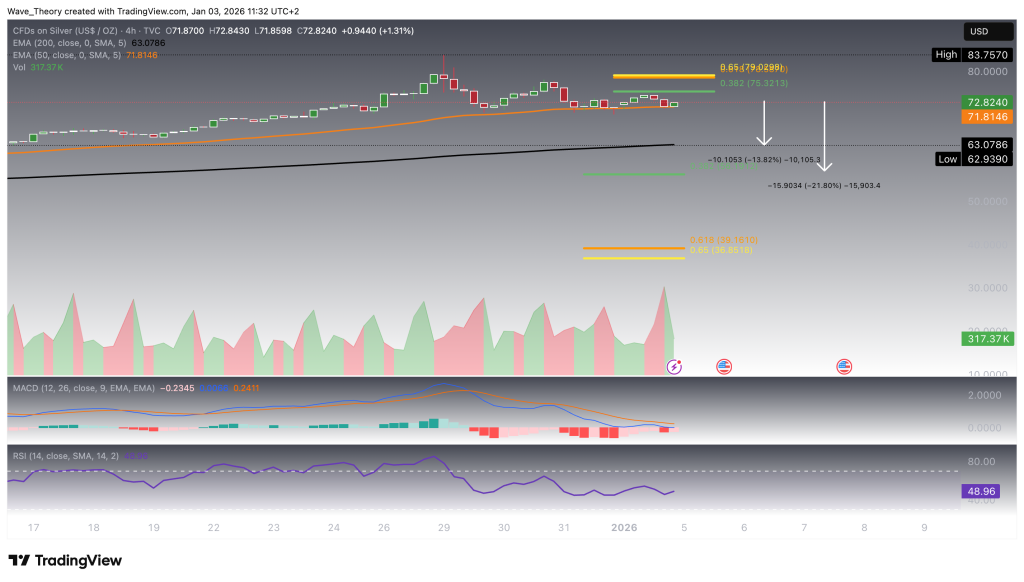
Silver — Short Summary & Key Levels
Silver is consolidating while holding above 4H 50-EMA support at $71.80, with the short-term trend remaining bullish as long as this level holds. Immediate resistance lies at $75.30 and $79.00.
A bearish break below $71.80 would expose downside toward the 4H 200-EMA, implying roughly 14% downside. Momentum is mixed: RSI is neutral, MACD lines remain bearishly crossed, but the MACD histogram is improving, suggesting weakening downside pressure.
Key Levels
-
Resistance: $75.30 → $79.00
-
Support: $71.80 (4H 50-EMA) → 4H 200-EMA (−14%)
- Check out our free forex signals
- Follow the top economic events on FX Leaders economic calendar
- Trade better, discover more Forex Trading Strategies
- Open a FREE Trading Account
- Read our latest reviews on: Avatrade, Exness, HFM and XM