Bitcoin Price Prediction: $5.3bn Whale Buying Pushes BTC Toward $96,500
Bitcoin is picking up where it left off, as large holders quietly rebuild their positions. The on-chain data from Santiment...

Quick overview
- Large Bitcoin holders, or whales and sharks, have accumulated over 56,227 BTC worth more than $5.3 billion since mid-December, indicating a positive trend.
- Retail wallets are unwinding their exposure, suggesting a divergence that may lead to upward price movement.
- Bitcoin's price has been trading in a range between $87,000 and $94,000, with key resistance at $93,500 and support at $90,000.
- Technical indicators show bullish momentum, with a potential target of $100,000 as traders await a breakout.
Bitcoin is picking up where it left off, as large holders quietly rebuild their positions. The on-chain data from Santiment is quite telling – it shows whales and sharks, those wallets with 10-10,000 BTC, have quietly accumulated another 56,227 BTC worth over $5.3 billion since mid-December. At the same time, smaller retail wallets have been unwinding their exposure – a divergence which is a good sign of things set to go upwards rather than downwards.
Santiment’s observation that crypto markets often do the opposite of what retail traders do also chimes in here. Whale activity tends to lead the price rather than follow it. This shift in ownership – with more of the Bitcoin supply being held by smaller wallets – is probably a good thing. There’s been a significant shift in Bitcoin’s supply concentration, with the share held by large wallets declining from 67% to 47%. That is a sign of a healthier spreading of ownership, rather than late-cycle accumulation.
Range Trading Still Defines the Overall Picture
Despite this accumulation trend, Bitcoin’s price has remained stuck in a fairly broad range. Since mid-November, it’s been trading between $87,000 and $94,000. Time and again it’s tried to break above this upper boundary but failed. Earlier this week, it briefly spiked up to $94,800 before losing steam.
One of the analysts, James Check, reckons that this is a sign of balance, not weakness. He argues that retail has been taking less out of this market, that there’s not much leverage in the futures markets. That recent upside pressure is actually coming from spot demand rather than a speculative squeeze. That sort of situation tends to be more supportive of the market than averse.
Key levels to watch for
- Resistance zone: $93,500 – $94,000
- The upper breakout risk is : $95,000 – $100,000
- the core support band: $88,000 – $90,000
Bitcoin Price Direction: What the Technicals Say
If we look at the 4-hour chart for Bitcoin, we see a clear improvement in the shape of things. The price has broken above that trendline that capped rallies since mid-November, and it even got confirmation on its way up above $90,000 with a run of consecutive bullish candles closing higher. That suggests there’s some follow-through buying rather than a short-lived scare.
If we also take a look at the 4-hour chart, we see that this move has resolved a symmetrical triangle, with the rising trendline support that came in from the $84,300 low still in place. Bitcoin is now in a familiar spot – trading near the 50% Fib retracement of that prior downswing, a common spot for a little bit of consolidation or even some more upside.
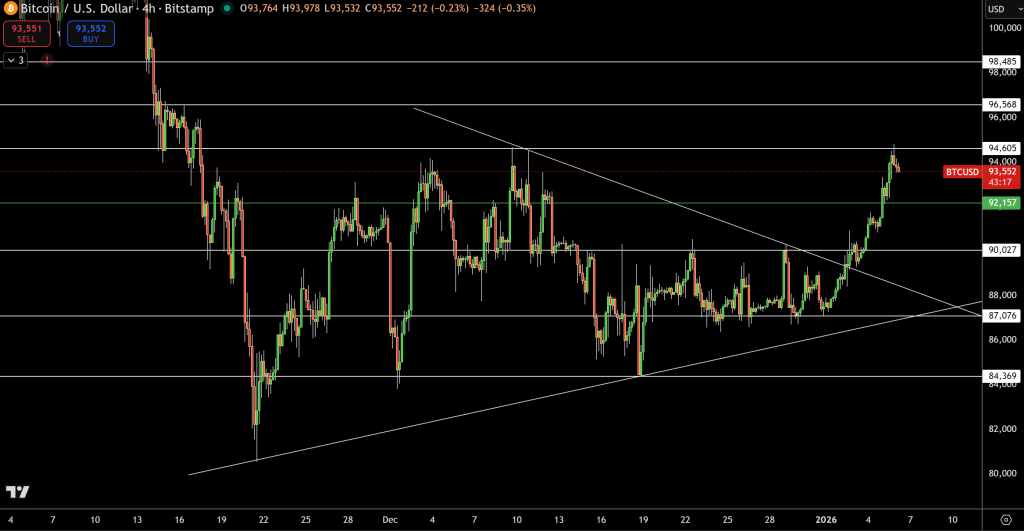
The immediate support level sits at $92,150, followed by $90,000, which has now become a key former resistance-turned-support level. And the RSI is still above the midline, so the bulls are still in charge without getting too carried away.
What Next for Bitcoin
If you add all this up – whales rebuilding their positions, retail pressure easing off, and the price breaking key technical barriers – Bitcoin looks pretty well positioned for a directional move. And when you look at the options data, it’s heavy on the $100,000 strike price, so a lot of people are waiting for the price to get to that level – and it might not be too long before it does.
Trade idea: Buy on any dips towards $92,150 and set your target at $96,500, with a stop-loss below $90,000.
- Check out our free forex signals
- Follow the top economic events on FX Leaders economic calendar
- Trade better, discover more Forex Trading Strategies
- Open a FREE Trading Account
- Read our latest reviews on: Avatrade, Exness, HFM and XM