TSM stock has surged approximately 460% over the past three years, with a notable 148% increase since April of last year.
Despite the overall bullish trend supported by strong technical indicators, early signs of momentum exhaustion and bearish divergence are emerging.
Immediate downside risks suggest a potential pullback of 5.7% to 11.7%, with key support levels around $302 and $280.
As long as TSM holds above the $247–$257 support zone, the broader bullish trend remains intact, but a break below $200 could shift the outlook significantly.
TSM stock has delivered an extraordinary rally, climbing roughly 460% over the past three years and more than 148% since April last year. With price action turning increasingly parabolic, investors are now asking the critical question: Is this powerful uptrend sustainable, or is TSM approaching a correction phase?
TSM Stock: Parabolic Surge Over the Past Few Years
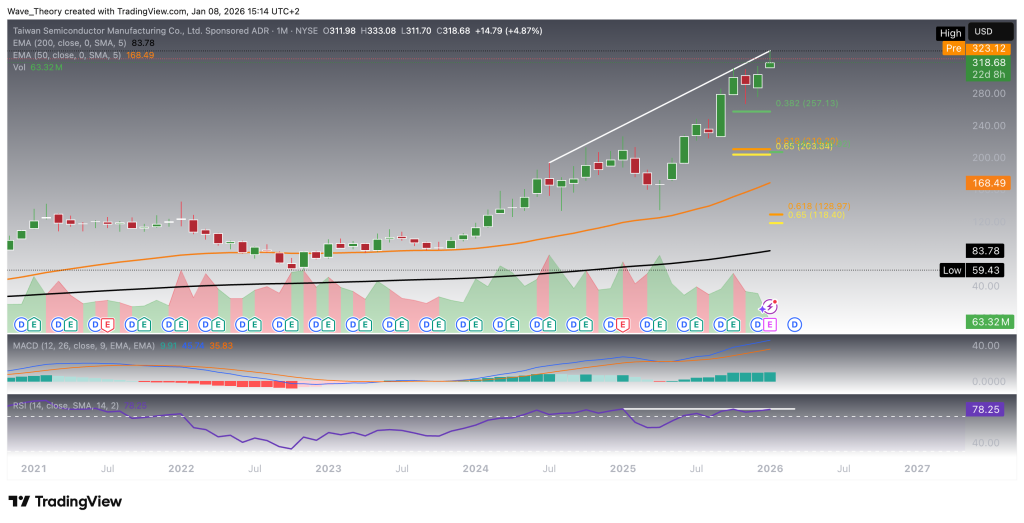
TSM stock has delivered a remarkably strong rally over the past several years, culminating in the formation of a new all-time high at $333. On the monthly timeframe, the technical structure remains predominantly bullish, supported by multiple long-term momentum and trend indicators.
The MACD is firmly constructive: the MACD lines are bullishly crossed, while the MACD histogram has been printing progressively higher bullish bars for several consecutive months, signaling sustained upside momentum and trend continuation on a structural level.
In addition, the exponential moving averages (EMAs) have completed a golden crossover, a classic long-term bullish signal that further confirms the prevailing uptrend and reinforces the strength of the broader bullish trend.
That said, despite the dominant bullish backdrop, early signs of potential momentum exhaustion are beginning to emerge. The Relative Strength Index (RSI) remains entrenched in overbought territory, and while price action continues to register higher highs, the RSI has started to move sideways rather than confirm these highs. This behavior introduces the risk of a developing bearish divergence, which—if confirmed—could signal waning momentum and increase the probability of a corrective or consolidation phase ahead.
TSM
TSM Stock: Bearish Divergence Emerging on the Weekly RSI
On the weekly timeframe, TSM stock is beginning to display early signs of momentum divergence. The Relative Strength Index (RSI) has formed a bearish divergence, even as price action continues to hold near recent highs. This divergence suggests that bullish momentum may be weakening beneath the surface.
Despite this warning signal, the broader technical structure remains constructive. The MACD lines are still bullishly crossed, and the MACD histogram has been ticking higher on the bullish side for the past three weeks, indicating that upside momentum has not yet fully rolled over.
In addition, the exponential moving averages (EMAs) continue to exhibit a golden crossover, reinforcing the bullish mid-term trend and confirming that the prevailing trend remains intact for now.
That said, given the bearish RSI divergence, TSM stock could be vulnerable to a corrective move in the near term. On the downside, the next key Fibonacci support levels are located at approximately $257 and $200. Further reinforcing this support zone, the 50-week EMA, currently around $247, provides an additional layer of technical support.
Should price action reach this confluence area, TSM stock could find support and bounce bullishly, potentially setting the stage for a continuation of its broader upward trajectory.
TSM
TSM Stock: Potential Downside of Approximately 23%
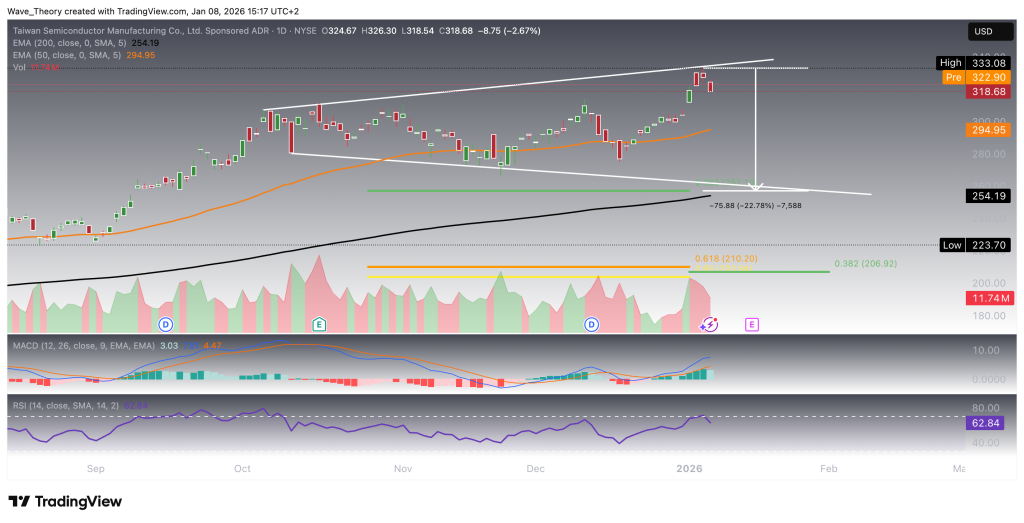
On the daily timeframe, TSM stock has continued to register higher highs, while recent price action has also produced a lower low followed by a higher low, indicating increasing volatility within the prevailing uptrend. At present, price is consolidating within a clearly defined range between $333 and $254, and a retracement toward the lower boundary of this range remains a realistic scenario.
A move toward the $254 region would imply a potential downside of roughly 23% from current levels. However, meaningful technical support is already present above that level. The 50-day exponential moving average (EMA), currently around $295, is acting as significant dynamic support and could limit the extent of any near-term pullback.
From an indicator perspective, the daily chart remains predominantly bullish. The EMAs continue to display a golden crossover, confirming a bullish trend in the short- to medium term. Additionally, the MACD lines remain bullishly crossed, although the MACD histogram has begun to tick lower on the bearish side today, signaling a short-term loss of momentum rather than a confirmed trend reversal. Meanwhile, the RSI is moving within neutral territory, suggesting that the market is neither overbought nor oversold at present.
In summary, TSM stock remains structurally very bullish, but short-term downside potential persists, particularly in the context of range-bound price action and early momentum cooling on the daily timeframe.
TSM
TSM Stock: Immediate Downside Potential of 5.7% to 11.7%
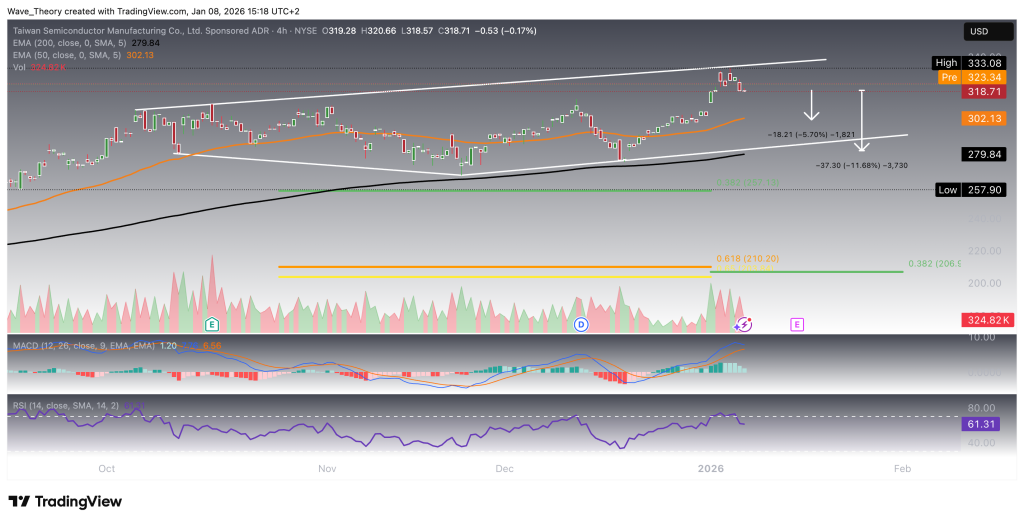
On the 4-hour timeframe, TSM stock presents a mixed technical picture. Trend-following indicators continue to support the bullish bias in the short term, while momentum indicators are beginning to show early signs of weakening.
The exponential moving averages (EMAs) and the MACD lines remain bullishly crossed, confirming that the short-term trend is still bullish. In addition, the Relative Strength Index (RSI) is moving within neutral territory, suggesting neither overbought nor oversold conditions at present.
However, despite this constructive trend structure, the MACD histogram has recently started to tick lower on the bearish side, indicating a loss of bullish momentum and increasing the probability of a near-term pullback.
As a result, TSM stock faces immediate downside risk of approximately 5.7% to 11.7%. On the downside, the next key dynamic support levels are provided by the 50-period EMA on the 4-hour chart at around $302 and the 200-period EMA on the 4-hour chart at approximately $280. A retracement into this zone would be technically healthy and could provide a base for the stock to stabilize before potentially resuming its broader upward trend.
TSM stock remains structurally bullish across higher timeframes, supported by a strong long-term uptrend, bullish EMA structures, and constructive MACD signals on the monthly, weekly, and daily charts. However, momentum divergences on the weekly RSI and cooling momentum on lower timeframes suggest an elevated probability of a near-term corrective or consolidation phase before the broader uptrend potentially resumes.
Immediate downside risk is present on the 4H and daily charts, with price vulnerable to a pullback toward dynamic EMA support levels. A deeper correction would remain technically healthy as long as key support zones hold.
Key Levels to Watch
Resistance / All-Time High:$333
Immediate Supports:
$302 — 50-EMA (4H)
$280 — 200-EMA (4H)
$295 — 50-EMA (daily)
Major Support Zone / Fib Confluence:
$257 – $247 — Fibonacci support + 50-EMA (weekly)
Structural Support:
$200 — Key Fibonacci level
Outlook:
As long as TSM holds above the $247–$257 support zone, the broader bullish trend remains intact. A successful bounce from these levels could set the stage for a continuation toward new highs, while a sustained break below $200 would invalidate the bullish structure and shift the outlook materially.
Konstantin Kaiser comes from a data science background and has significant experience in quantitative trading. His interest in technology took a notable turn in 2013 when he discovered Bitcoin and was instantly intrigued by the potential of this disruptive technology.