BlackRock stock has surged over 276% since the COVID lows, reaching an all-time high near $1,220.
Despite the bullish long-term trend, momentum indicators show signs of fatigue, indicating potential consolidation ahead.
Key resistance is at $1,141, while immediate support levels are around $1,059 and $1,045.
A breakout above $1,141 could lead to further gains, but failure to hold support may result in a deeper correction.
BlackRock is the world’s largest asset manager, overseeing trillions of dollars in assets across equities, fixed income, alternatives, and ETFs. As a global financial heavyweight, its stock often serves as a bellwether for broader capital market sentiment and institutional investment trends.
BlackRock Stock Surges Over 276% Since the COVID Lows
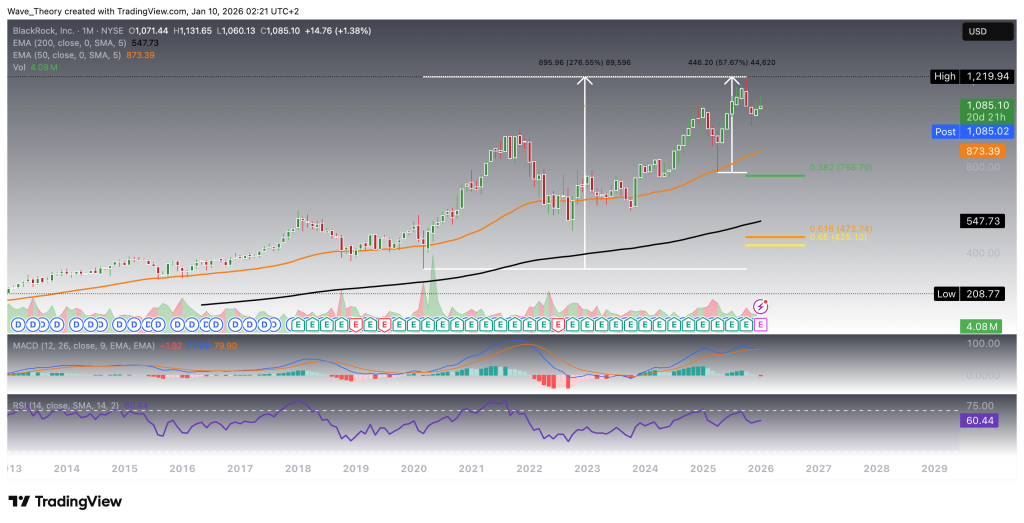
BlackRock stock has delivered an exceptional long-term rally, advancing by over 276% from the 2020 COVID-era lows and gaining approximately 58% since May of last year. During the recent corrective phase, price action retraced toward the 50-month exponential moving average (EMA) at around $873, where the stock successfully found support and rebounded bullishly.
Following this rebound, BlackRock extended its advance and went on to register a new all-time high near $1,220, reinforcing the strength of the broader uptrend. However, despite this price strength, momentum indicators are beginning to show signs of fatigue. The MACD lines are on the verge of a bearish crossover, while the MACD histogram has been ticking lower on the bearish side for several months, pointing to a gradual loss of upside momentum. At the same time, the Relative Strength Index (RSI) is moving within neutral territory, suggesting neither overbought nor oversold conditions.
On the bullish side, the exponential moving averages (EMAs) continue to display a golden crossover, confirming that the long-term trend remains bullish despite emerging momentum divergence signals.
BlackRock
BlackRock Stock Forms a Series of Higher Highs and Higher Lows
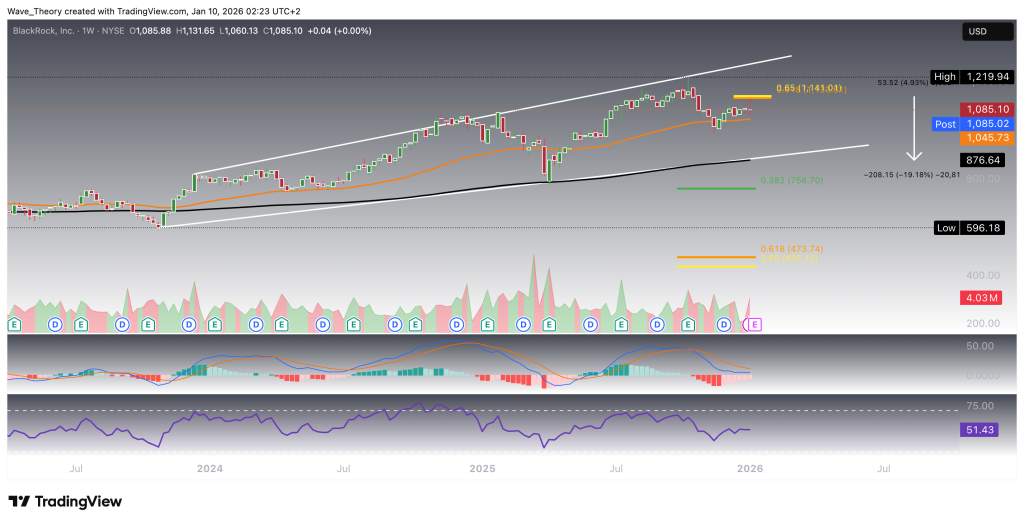
On the weekly timeframe, BlackRock stock continues to maintain a structurally bullish market structure, characterized by a clear sequence of higher highs and higher lows. However, price action has recently faced rejection at the golden ratio resistance around $1,141, a key level that must be broken decisively to the upside in order for BlackRock to fully re-enter its broader uptrend.
At present, the stock is drifting lower and approaching the 50-week exponential moving average (EMA), which is providing near-term support at approximately $1,045. A sustained breakout above the $1,141 resistance would imply upside potential of roughly 5% from current levels. Conversely, failure to hold above intermediate support increases the risk of a deeper retracement toward the 200-week EMA at around $877, which would represent a potential downside of approximately 19%.
From a risk-reward perspective, this imbalance suggests that downside risk currently outweighs upside potential in the immediate term.
Momentum and trend indicators on the weekly chart present a mixed technical picture. The exponential moving averages (EMAs) continue to display a golden crossover, confirming that the mid-term trend remains bullish. The Relative Strength Index (RSI) is positioned in neutral territory, indicating neither overbought nor oversold conditions. Meanwhile, the MACD histogram has been ticking higher on the bullish side over recent weeks, although the MACD lines remain crossed bearishly, suggesting that bullish momentum has yet to fully reassert itself.
BlackRock
Will BlackRock Stock Break Out Bullishly?
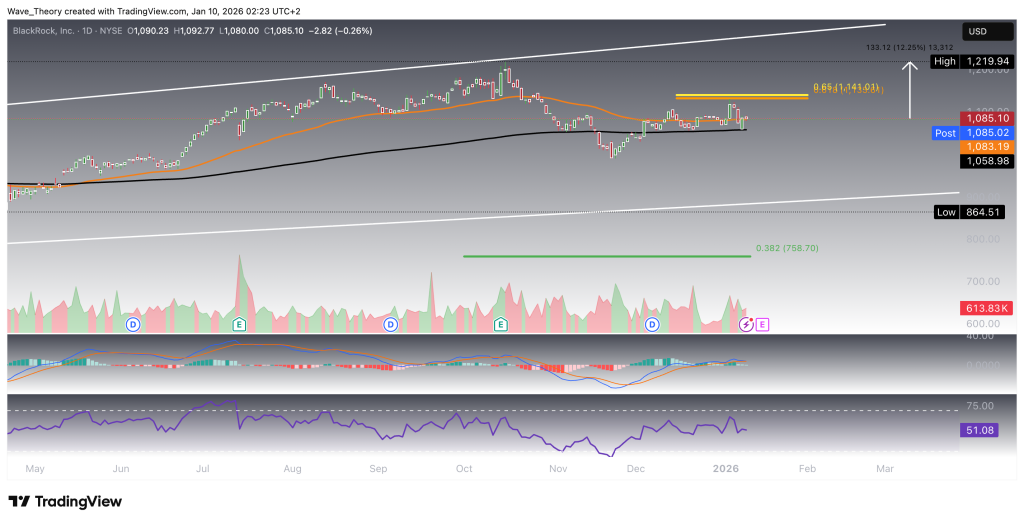
BlackRock stock is currently finding support at the 200-day exponential moving average (EMA) around $1,059. If price holds above this level and manages to break bullishly above the golden ratio resistance at $1,141, the stock could resume its upward trajectory and retest its all-time high at approximately $1,220, implying upside potential of around 12% from current levels.
On the downside, a break below key support levels would open the door for a deeper correction toward the 0.382 Fibonacci support at roughly $759, representing a significantly lower downside target.
From an indicator perspective, the daily chart remains predominantly bullish. Both the EMAs and MACD lines are crossed bullishly, confirming a bullish trend in the short- to medium term. That said, momentum has weakened slightly, as the MACD histogram has been ticking lower, while the Relative Strength Index (RSI) continues to move within neutral territory, suggesting consolidation rather than immediate continuation.
BlackRock
Golden Crossover on the Horizon
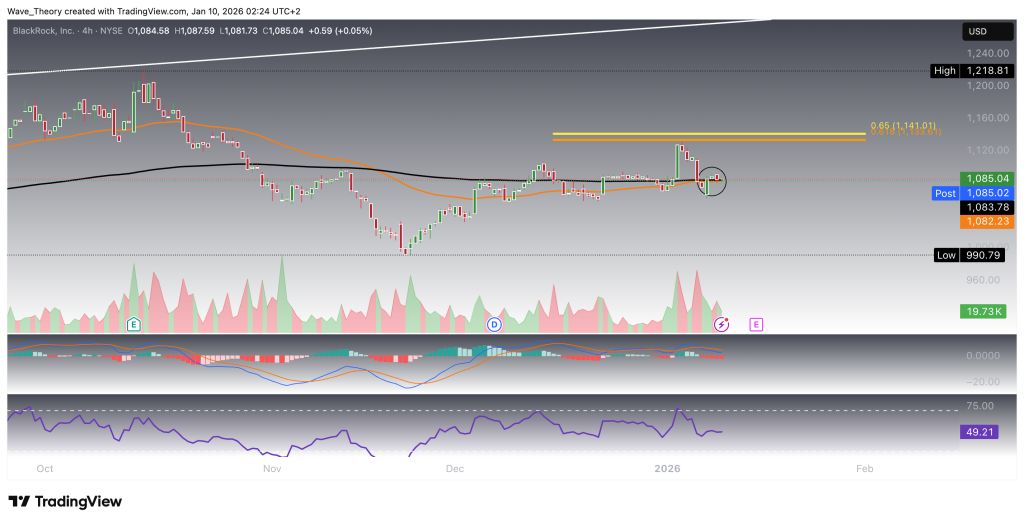
On the 4-hour chart, the indicators currently deliver mixed signals. The MACD lines are crossed bearishly, and the MACD histogram continues to trend sharply lower, reflecting persistent short-term downside momentum. Meanwhile, the Relative Strength Index (RSI) remains in neutral territory, offering neither bullish nor bearish confirmation at this stage.
That said, the EMAs are on the verge of forming a golden crossover. Should this crossover materialize, it would confirm the trend bullishly on the short-term timeframe and potentially trigger bullish confirmation across all higher timeframes, marking a key shift in market structure.
BlackRock
Summary & Key Levels
BlackRock stock remains structurally bullish across higher timeframes, but shows more downside risk than upside in the immediate term. While long-term EMAs continue to display golden crossovers, momentum indicators (MACD and RSI) signal weakening upside strength, suggesting a potential consolidation or corrective phase before trend continuation.
Major Support: $877 (200-week EMA), $759 (0.382 Fib)
A bullish breakout above $1,141 could open the door toward the $1,220 ATH, while a loss of current supports increases the probability of a deeper retracement toward the $877–$759 zone.
Konstantin Kaiser comes from a data science background and has significant experience in quantitative trading. His interest in technology took a notable turn in 2013 when he discovered Bitcoin and was instantly intrigued by the potential of this disruptive technology.