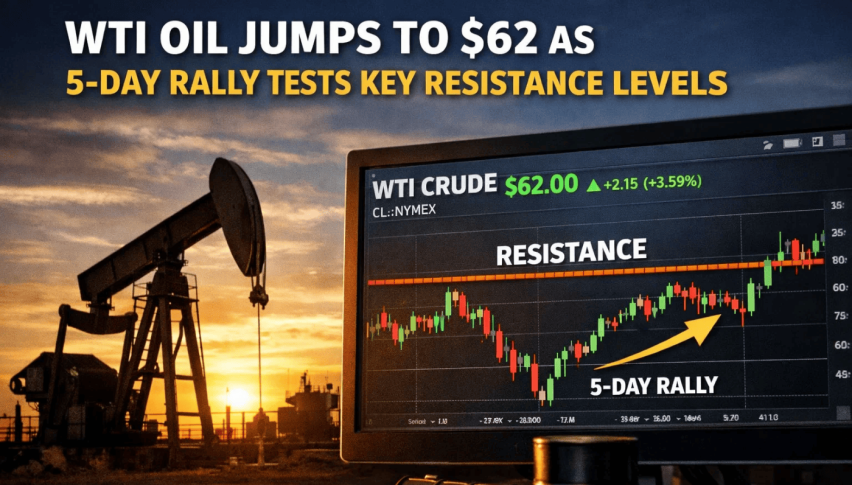
WTI Oil Jumps to $62 as 5-Day Rally Tests Key Resistance Levels
WTI crude oil crept closer to $61.90 a barrel, marking five consecutive days of gains and its highest level since early October...
Quick overview
- WTI crude oil has reached nearly $61.90 a barrel, marking five consecutive days of gains due to rising tensions in the Middle East.
- Concerns over potential supply disruptions from Iran have overshadowed a significant increase in US crude inventories.
- The technical outlook for WTI is positive, with key support established around $60.00-$60.40 and a bullish breakout pattern.
- Traders are advised to consider buying if prices drop to $60.40, with a target range of $62.75-$63.75.
WTI crude oil crept closer to $61.90 a barrel, marking five consecutive days of gains and its highest level since early October. This upswing stems largely from rising global tensions in the Middle East, which have pushed energy prices higher.
Concerns have escalated following reports that US personnel had been advised to leave a military base in Qatar, a location that’s come under attack several times in the past when regional conflicts escalated. As yet, no actual supply disruptions have occurred, but markets are getting anxious that Iran’s production – already at an estimated 3.3 million barrels a day – could come under threat if things get worse.
Those worries have outweighed something else that should normally have curbed prices: US crude inventories have risen by a healthy 5.3 million barrels, with similar increases in gasoline and distillate stockpiles. Usually, that sort of data would put a cap on prices. But for now, the potential for supply disruption is the dominant story.
Inventory Builds Get Side-Lined
It’s not the first time we’ve seen this with oil prices – when there’s high geopolitical risk, traders tend to ignore short-term data and focus on possible supply shocks instead.
That’s kept crude prices high, even amid mixed signals on the broader economic picture. The result is a market that’s happy to hang on to higher prices, waiting for more news on both the Middle East situation and upcoming demand indicators.
WTI Crude Oil Breaks Out – and the Chart Changes
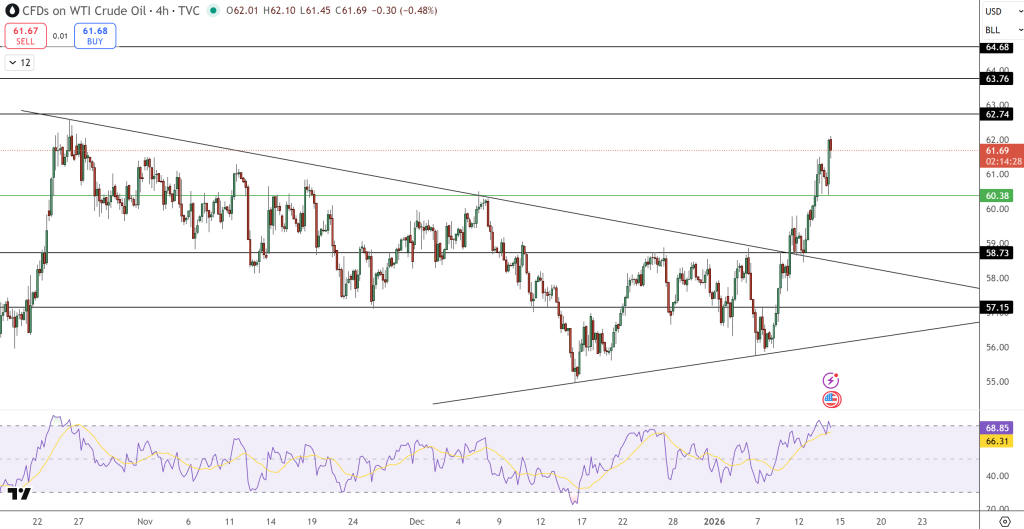
Technically, the outlook for WTI has turned sharply better. On the four-hour chart, crude has decisively broken through a symmetrical triangle that had been holding the price back for most of November and December.
Some key things to look at:
- A previous resistance zone around $60.00-$60.40 has flipped into support.
- A rising trendline is now forming from that December low near $56.
- RSI is around 68, which is a pretty strong reading without any signs of divergence.
The breakout candle was quite a strong one – a solid-looking bullish body with a short upper wick, which suggests that buyers have taken the high ground here and aren’t going to let the price slip back down again. No reversal signals, like doji or bearish engulfing candles, have appeared so far.
What’s Next for WTI Crude
As long as the price stays above $60.40, the technical outlook is very positive. The first level of resistance is about $62.75, with a higher target around $63.75. If the price does pull back, it’s likely to be seen as just a correction, not the start of a bigger trend reversal.
Trading Focus: If the price drops back to $60.40, it’s a good idea to consider buying – set a stop-loss just below $58.70, with a target in the $62.75-$63.75 zone, as long as the breakout structure stays intact.
- Check out our free forex signals
- Follow the top economic events on FX Leaders economic calendar
- Trade better, discover more Forex Trading Strategies
- Open a FREE Trading Account
- Read our latest reviews on: Avatrade, Exness, HFM and XM