Netflix (NFLX) Stock Looks Ready for a Bounce — Key Levels to Watch

Quick overview
- Netflix stock has reached a significant Fibonacci support level at $89 after a 35% correction over seven months.
- A bullish reaction from this support could target resistance levels at $106 and $118, potentially leading to a return to the all-time high of $134.
- Short-term momentum indicators are mixed, with death crosses on the daily and 4-hour charts suggesting bearish trends, while long-term trends remain bullish.
- A break below $89 could extend the corrective move, with key support levels at $75 and $60, the latter being crucial for maintaining the overall bullish structure.
Following a seven-month corrective move, Netflix stock has arrived at a significant Fibonacci support level, where downside momentum may begin to fade and a bullish bounce could emerge.
Technical Outlook: Netflix at a Critical Inflection Point
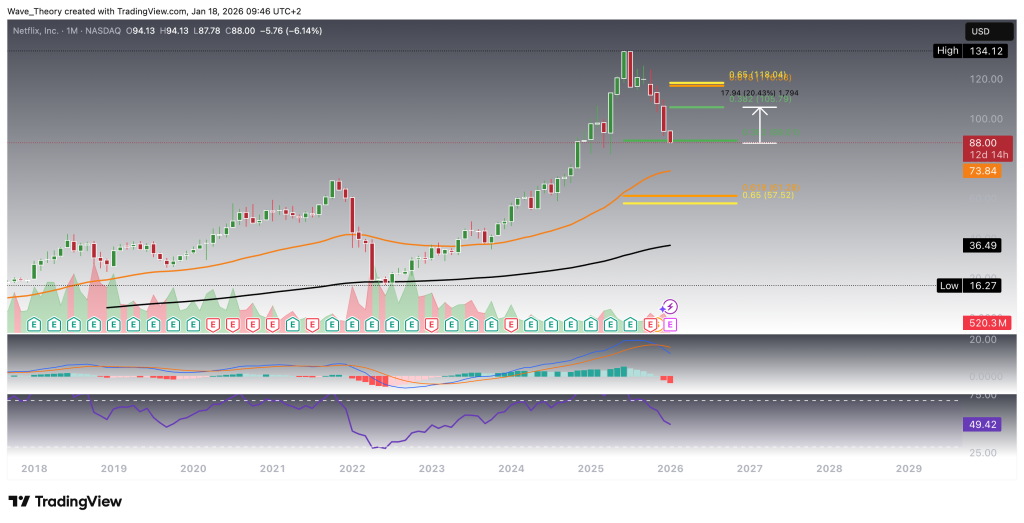
Netflix stock has corrected by roughly 35% over the past seven months and has now reached a major Fibonacci support level near $89. This zone represents a technically significant area where price could establish a bullish base and initiate a rebound.
From this support, Netflix could stage a bullish reaction of approximately 20%, targeting the next key Fibonacci resistance around $106. A decisive breakout above this level would open the door toward the golden ratio resistance at $118. Should price successfully clear this level, the broader correction would be invalidated, signaling a resumption of the primary uptrend and paving the way for a move back toward the prior all-time high at $134 — or potentially beyond.
From a trend perspective, the exponential moving averages remain in a golden crossover configuration, confirming that the long-term trend structure is still bullish. However, momentum indicators paint a more cautious near-term picture. The MACD lines have crossed bearishly, and the MACD histogram has been ticking lower for several consecutive months, indicating weakening bullish momentum. Meanwhile, the RSI is oscillating within neutral territory, suggesting neither overbought nor oversold conditions at this stage.
Overall, Netflix is positioned at a technically critical inflection point, where structural support aligns with mixed momentum signals — setting the stage for a potential bullish reversal, provided key resistance levels are reclaimed.
Netflix (NFLX) Shows Mixed Signals on the Weekly Chart
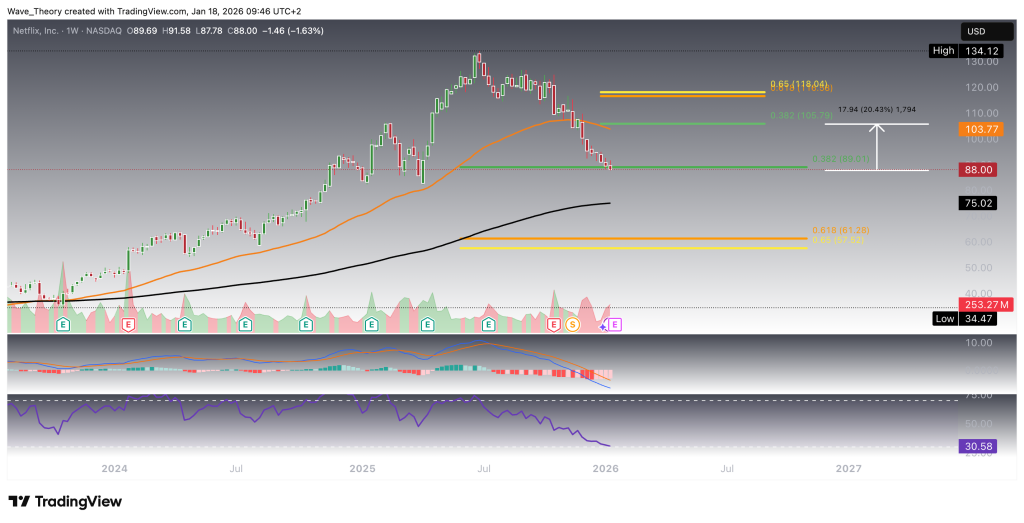
On the weekly timeframe, the exponential moving averages remain in a golden crossover configuration, confirming that the mid-term trend structure is still bullish. Momentum, however, remains mixed. While the MACD histogram has been ticking bullishly higher over the past few weeks, the MACD lines are still bearishly crossed, indicating that upside momentum has yet to fully reassert itself.
Meanwhile, the RSI is approaching oversold territory, but currently provides no clear bullish or bearish divergence, suggesting a neutral momentum environment. From a price-action perspective, a bullish reaction at the 0.382 Fibonacci support near $89 would be constructive. In that scenario, Netflix would likely face initial overhead resistance at the 50-week EMA around $104.
However, a decisive break below the 0.382 Fibonacci support at $89 would likely extend the corrective move, exposing downside targets at the 200-week EMA near $75, followed by the golden ratio support around $60. Importantly, as long as Netflix holds above the golden ratio level at $60, the broader structural trend remains bullish, despite short-term weakness.
Death Cross Emerges on the Daily Chart
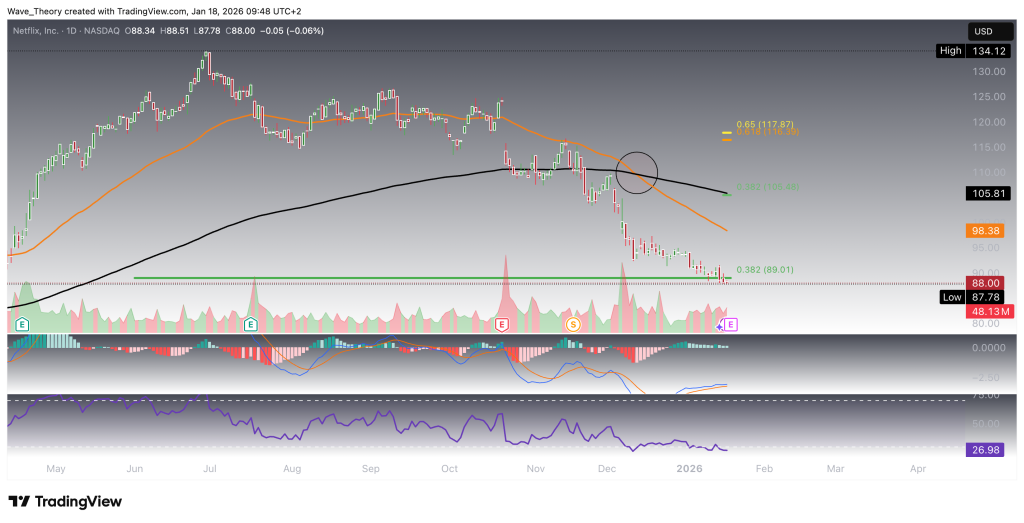
On the daily timeframe, the exponential moving averages have formed a death cross, confirming a bearish short- to medium-term trend structure. Momentum signals, however, remain mixed. The MACD lines are bullishly crossed, while the MACD histogram has been ticking bearishly lower, indicating weakening upside momentum despite the recent crossover.
Meanwhile, the RSI has reached oversold territory, but currently shows no clear bullish or bearish divergence, leaving momentum direction unresolved. From a price-action perspective, Netflix retains the potential to bounce bullishly, with the next Fibonacci resistance levels located at $106 and $118.
Netflix (NFLX)
Similar Outlook on the 4H Chart
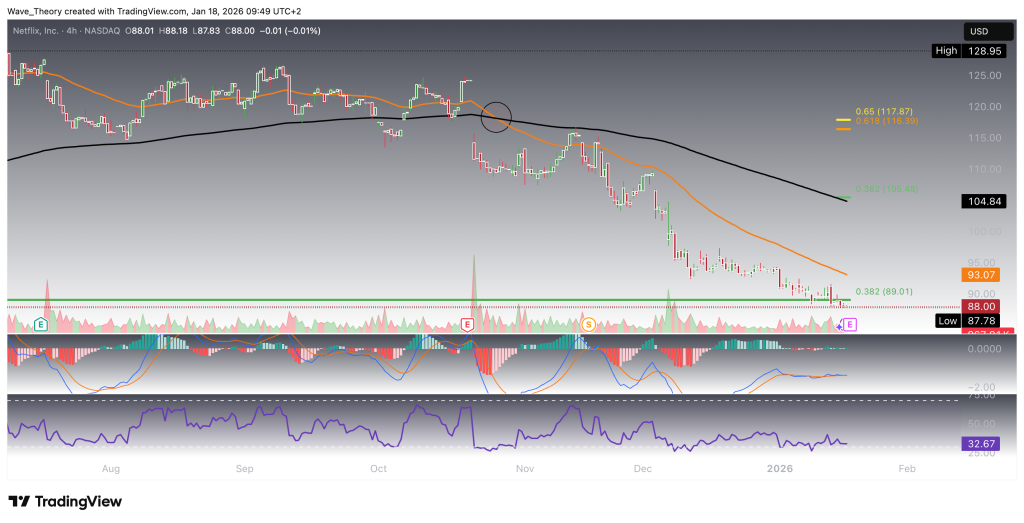
On the 4-hour timeframe, the exponential moving averages have likewise formed a death cross, confirming a bearish short-term trend structure. Momentum indicators remain indecisive. The MACD lines are prone to crossing both bullishly and bearishly, while the MACD histogram alternates between bullish and bearish readings, reflecting a lack of directional conviction. Meanwhile, the RSI is oscillating within neutral territory, offering no clear momentum signal.
Overall, several indicators continue to lean bearish in the short term. Nevertheless, the crucial Fibonacci support level remains intact and may present a favorable risk–reward entry zone for optimistic Netflix bulls, should price action confirm a bullish reaction.
Summary & Key Levels
Netflix remains at a critical technical inflection point across multiple timeframes. While the long-term and mid-term structure remains constructive, supported by a golden EMA crossover on higher timeframes, short-term momentum is mixed to bearish, with death crosses on the daily and 4H charts and conflicting MACD signals.
Price is currently testing major Fibonacci support at $89, a level that represents a make-or-break zone. A confirmed bullish reaction from this area could open the door for a rebound toward $106, followed by $118 at the golden ratio resistance. A sustained breakout above $118 would likely invalidate the broader correction and shift focus back toward the all-time high at $134 or higher.
On the downside, a break below $89 would expose $75 at the 200-week EMA, with the golden ratio support at $60 acting as the final structural support. As long as Netflix holds above $60, the broader bullish market structure remains intact, despite ongoing short-term weakness.
Key Levels to Watch:
- Support: $89 → $75 → $60
- Resistance: $106 → $118 → $134
- Check out our free forex signals
- Follow the top economic events on FX Leaders economic calendar
- Trade better, discover more Forex Trading Strategies
- Open a FREE Trading Account
- Read our latest reviews on: Avatrade, Exness, HFM and XM