WTI Crude Oil at $59.5: Oil Slips Below $60 as Supply Risks Clash With Oversupply
WTI crude oil has lost momentum after a brief run-up to nearly $61, slipping back beneath $60 as markets reassess...

Quick overview
- WTI crude oil has slipped below $60 after a brief rise, as markets reassess risks and uncertainties.
- A force majeure has impacted a major Kazakh oilfield, while Venezuela's production recovery remains slower than expected.
- The IEA warns of an emerging oversupply, predicting that global oil supply will exceed demand by 2026.
- Technical indicators suggest WTI is struggling to maintain momentum, with key support levels being closely monitored.
WTI crude oil has lost momentum after a brief run-up to nearly $61, slipping back beneath $60 as markets reassess the risks and uncertainties ahead. Early in the week, gains were driven by easing geopolitical tensions, which certainly reduced the immediate worry that global energy demand might take a hit, but supply-side issues kept prices from slipping too far, even if only for the time being.
A force majeure has put a major Kazakh oilfield out of commission, potentially leaving output from two large fields down for another week or so at least. And then we have the ongoing struggles in Venezuela, where exports are not where folks had thought they would be after such a long, tough period, which still points to a slower-than-expected recovery in production. That, combined with supply-side woes, helped keep prices steady early in the week, even as broader macroeconomic signals were mixed.
IEA Oversupply Warning Catches the Market Off Guard
The thing is, though, that the support that was there earlier in the week is now struggling to keep up with the growing consensus that an oversupply picture is emerging. The International Energy Agency (IEA) has reaffirmed that global oil supply will exceed demand in 2026, and even with the IEA bumping up its forecast for oil demand growth, it’s still saying it won’t be enough to keep up with the rise in non-OPEC supply.
Over in the US, the latest data on crude oil inventories showed a 3 million-barrel increase week on week, and that did nothing to alleviate the concern that supply is climbing faster than demand. And with all this put together, it has become tough for bulls to make a case for pushing prices any higher, which has shifted the focus back to technical levels and where the price might be headed from here.
WTI Technical Picture gets a bit Wobbly below $60
From a purely technical standpoint, though, on the two-hour chart, WTI is now trading around $59.50 after failing to hold above the key $60.00-$60.10 resistance zone. The more recent price action shows some long upper wicks near $60.80, which is a pretty clear sign that supply pressure is building and momentum is starting to fade, rather than any kind of aggressive selling.
Price is pulling back towards the rising trend line that has been guiding the market upward since early January now, and the structure of the market remains broadly constructive, but just not quite as convincing:
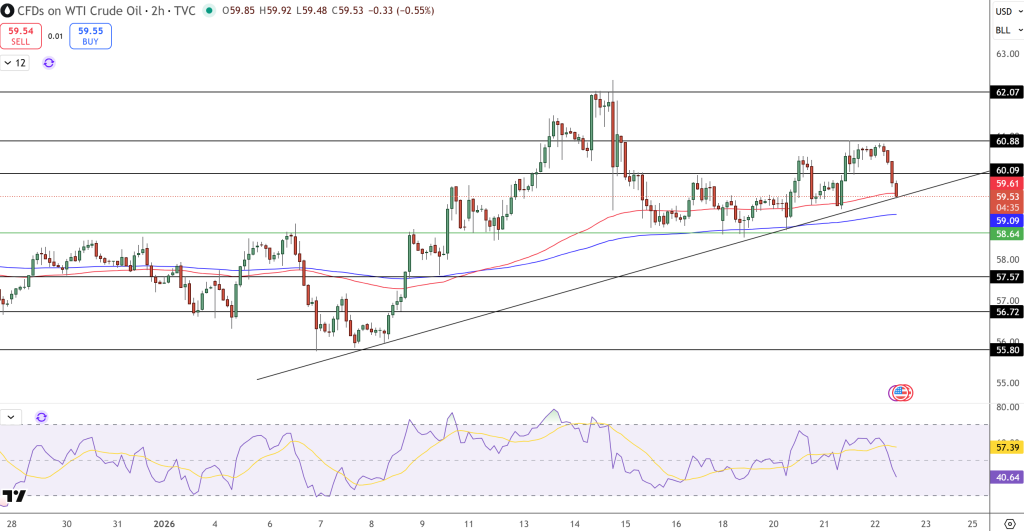
- 200-EMA: Still holding firm at around $59.10 – that’s dynamic support
- 50-EMA: Actually flattening out at around $59.60 – which is not what we want to see when we’re looking for momentum to build
- Support levels: $58.65 then $57.60 (where the Fibonacci levels overlap)
- Resistance levels: $60.10 and $60.90
RSI has cooled off towards the 40 mark, so we wouldn’t say we’re looking at a crash-and-burn situation yet, but at the same time, it is a sign that momentum is slowing without falling into full-blown oversold territory. The best part is that there is no clear picture of a topping pattern or completed triangle – it seems to be consolidation within a wider up-sloping channel rather than any sort of major trend break.
What Traders are Watching Next
With the fundamentals still going back and forth, it looks like the immediate price action will be influenced by technicals, with the trendline support holding or prices dropping lower. The market is watching whether that support holds or gives way to even lower prices.
Trade Idea: Sell a clean break below $58.60, target $57.60, stop loss at least over $60.10.
- Check out our free forex signals
- Follow the top economic events on FX Leaders economic calendar
- Trade better, discover more Forex Trading Strategies
- Open a FREE Trading Account
- Read our latest reviews on: Avatrade, Exness, HFM and XM
Related Articles

Sidebar rates
Related Posts
