Intel Corporation (INTC) Stock Goes Parabolic; More Upside to Come?
Quick overview
- Intel's stock has surged over 209% since April, indicating a significant recovery and shift in market sentiment.
- Despite facing near-term resistance at $53, the overall technical structure suggests a bullish long-term outlook supported by momentum indicators.
- Immediate downside risks exist, with potential retracement levels around $41 and $32.5, which could serve as strong support zones.
- The stock is currently finding support at the 50-period EMA around $44, which is critical for maintaining short-term bullish momentum.
While competitors like Nvidia have already seen massive bull runs, Intel (INTC) has largely been left behind. That gap is now beginning to close—putting Intel back in the spotlight.
Intel Stock Surged By 209 % Since April
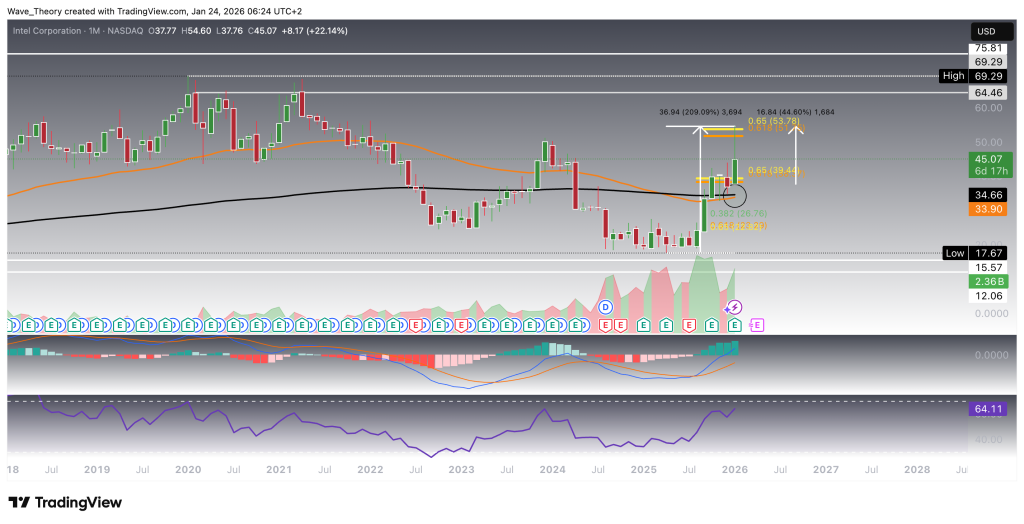
Intel Corporation (INTC) has delivered a remarkable recovery since April of last year, rallying more than 209% from its cycle lows. Momentum has accelerated sharply in recent weeks, with the stock gaining approximately 45% in the current month alone, underscoring a decisive shift in market sentiment.
From a technical perspective, INTC cleanly broke above the golden ratio resistance near $39, a level that had previously capped upside attempts. Following this breakout, price advanced rapidly toward the next Fibonacci golden ratio resistance at $53, where it encountered significant selling pressure and a notable rejection, signaling that this level is currently acting as a key technical barrier.
Despite this near-term rejection, longer-term indicators remain constructive. On the monthly timeframe, the MACD lines have completed a bullish crossover, while the MACD histogram continues to expand to the upside, reflecting strengthening underlying momentum and trend persistence. In parallel, the exponential moving averages (EMAs) are approaching a potential golden crossover, which—if confirmed—would serve as a strong long-term bullish trend validation.
Importantly, the Relative Strength Index (RSI) remains in neutral territory, indicating that the rally has not yet pushed the stock into overbought conditions and leaving room for further price development should momentum remain intact.
Overall, while Intel faces near-term resistance at the $53 Fibonacci level, the broader technical structure suggests a bullish long-term setup, supported by momentum indicators, trend signals, and the absence of momentum exhaustion.
Similar Outlook On The Weekly Chart Of Intel Corporation Stock
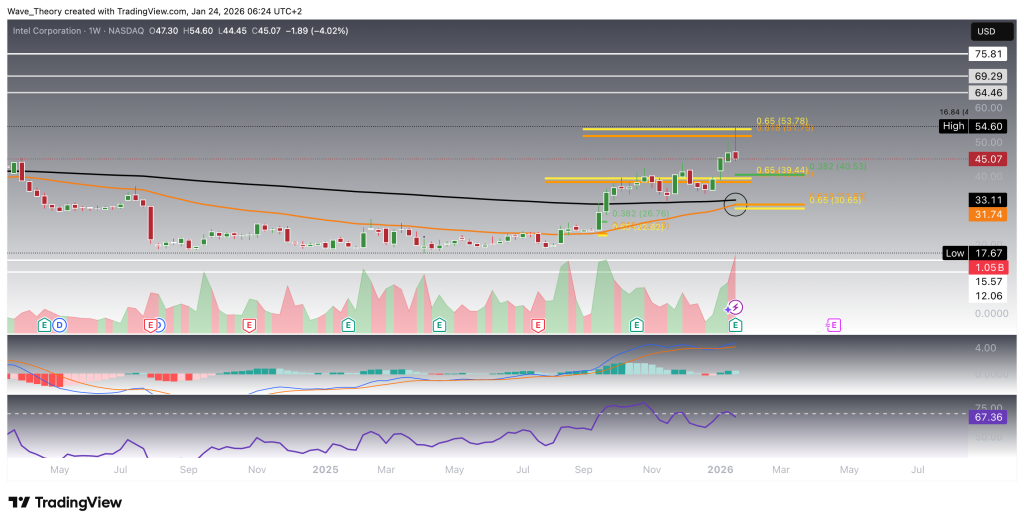
On the weekly timeframe, the technical structure remains constructive but shows early signs of consolidation risk. The exponential moving averages (EMAs) are on the verge of forming a golden crossover, which—once confirmed—would validate the prevailing uptrend on a mid-term horizon.
At the same time, momentum signals are beginning to diverge. While the MACD lines remain bullishly crossed, indicating that the broader trend is still intact, the MACD histogram has started to tick lower this week, suggesting waning upside momentum in the near term.
This loss of momentum is further reinforced by the Relative Strength Index (RSI), which has formed a bearish divergence. Notably, this divergence aligns with the clear bearish rejection at the Fibonacci golden ratio resistance near $53, strengthening the case for a potential corrective phase.
Should Intel enter a pullback, the next key Fibonacci support zones are located around $40 and $31. These levels represent structurally significant areas where bullish demand could re-emerge, potentially setting the stage for a trend-continuation rebound if broader market conditions remain supportive.
Overall, while the medium- to long-term trend structure remains bullish, short-term indicators suggest that a corrective phase would be technically healthy, allowing momentum to reset before any sustained continuation attempt.
Intel Stock: Immediate Downside Risk of 11%–32%
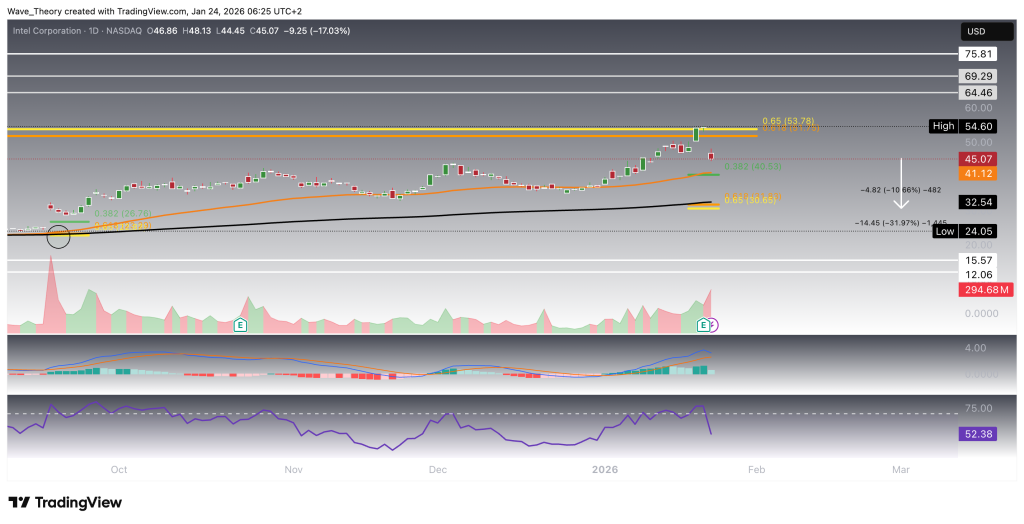
Intel Corporation (INTC) currently faces immediate downside potential of approximately 11% to 32%, should price retrace toward the next major Fibonacci support zones.
The most relevant downside support levels are located around $41 and $32.5. These zones carry strong technical confluence, as the 50-day EMA and the 200-day EMA align closely with the respective Fibonacci support levels, reinforcing their significance as potential stabilization or rebound areas.
Despite this short-term downside risk, the broader trend structure on the daily timeframe remains constructive. The exponential moving averages have already established a golden crossover, confirming the trend bullishly in the short- to medium-term.
Momentum indicators largely support this view. The MACD lines remain bullishly crossed, signaling that the prevailing trend is still intact, while the Relative Strength Index (RSI) continues to trade in neutral territory, suggesting the market is neither overbought nor oversold.
At present, the only notable bearish signal comes from the MACD histogram, which has begun to tick lower, indicating a loss of upside momentum and increasing the probability of a near-term corrective move.
In summary, while Intel may experience a controlled pullback toward the $41–$32.5 support range, the overall technical structure remains bullish, with trend confirmation intact and downside levels offering technically favorable zones for potential bullish reactions.
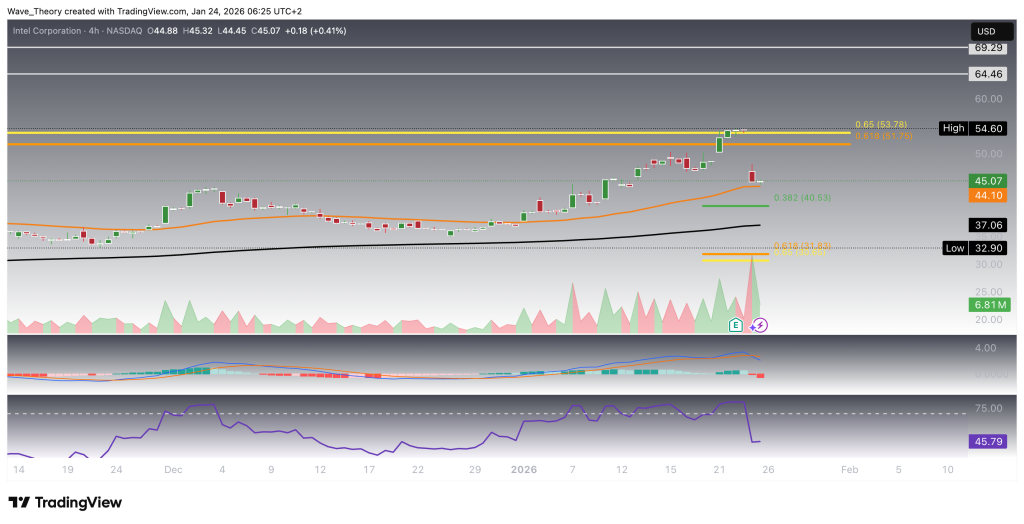
Intel Stock Finds Immediate Support at the 50-4H EMA
Intel Corporation (INTC) is currently finding immediate support at the 50-period EMA on the 4-hour chart, located around $44. As long as this level holds, it acts as a short-term stabilizing zone. However, a decisive bearish break below this support would likely open the door to a deeper corrective move toward the next Fibonacci support levels.
From a trend perspective, the exponential moving averages on the 4-hour timeframe remain in a golden crossover configuration, confirming that the short-term trend structure is still bullish.
That said, momentum indicators have weakened. The MACD lines have crossed bearishly, and the MACD histogram has been ticking lower in recent sessions, signaling increasing downside momentum and a loss of short-term bullish pressure.
Meanwhile, the Relative Strength Index (RSI) remains neutral, providing neither bullish nor bearish confirmation at this stage.
In summary, while trend signals remain constructive in the short term, deteriorating momentum suggests that the $44 EMA support is a critical inflection point, with a breakdown likely triggering a more pronounced corrective phase.
Intel (INTC) – Technical Summary & Key Levels
Intel Corporation (INTC) remains structurally bullish across the higher timeframes, supported by a potential formation of golden crossovers by the EMAs on the monthl and weekly and intact formation on the 4H and daily charts, confirming a positive long-, mid-, and short-term trend. Momentum indicators largely support this structure, with MACD lines bullishly crossed on the higher timeframes and the RSI generally trading in neutral territory, indicating no signs of broader trend exhaustion.
However, near-term momentum has weakened, as evidenced by a bearish rejection at the Fibonacci golden ratio resistance near $53, accompanied by bearish RSI divergence on the weekly chart and declining MACD histograms on the daily and lower timeframes. On the 4-hour chart, INTC is currently holding immediate support at the 50-4H EMA around $44, which acts as a critical short-term inflection level.
Key Levels to Watch
-
Resistance:
-
$53 – Major Fibonacci golden ratio resistance and recent rejection zone
-
-
Immediate Support:
-
$44 – 50-4H EMA on the 4H chart
-
-
Major Fibonacci Support Zones:
-
$41 – Confluence of Fibonacci support and the 50-day EMA
-
$32–33 – Strong Fibonacci support aligned with the 200-day EMA
-
Outlook
As long as $44 holds, Intel may consolidate before attempting another upside continuation. A break below $44 would likely trigger a corrective move toward $41 or potentially $32–33, where strong technical confluence suggests a higher probability of a bullish rebound. Overall, any pullback into these support zones would remain technically healthy within the broader bullish trend structure.
- Check out our free forex signals
- Follow the top economic events on FX Leaders economic calendar
- Trade better, discover more Forex Trading Strategies
- Open a FREE Trading Account
- Read our latest reviews on: Avatrade, Exness, HFM and XM
Related Articles

Sidebar rates
Related Posts
