Gold Sees Sharp 14% Sell-Off in One Day After Strong Rally

Quick overview
- Gold has retraced approximately 16.5% after reaching a new all-time high of $5,602, raising questions about the sustainability of the uptrend.
- Despite the recent decline, long-term indicators remain bullish, suggesting that the broader trend is still intact.
- Key support levels to watch include $4,684 at the 200-period 4H EMA and $3,760 at the confluence of the 50-day and 200-day EMAs.
- A decisive break below the $3,760–$2,742 support zone could signal a potential bear trend.
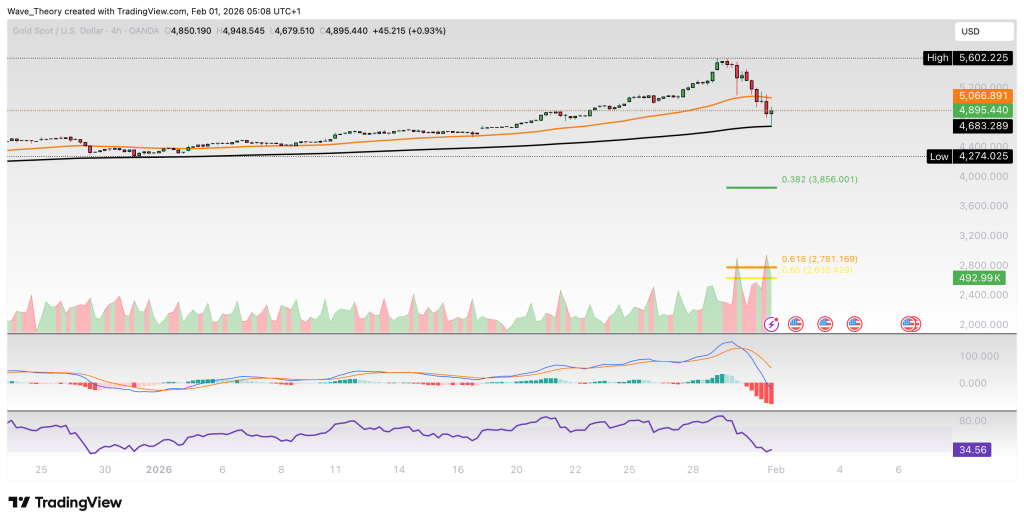
Since marking a new all-time high at $5,602 on Thursday, gold has retraced approximately 16.5%, including a sharp 14% decline on Friday alone. The key question now is whether this move represents a healthy correction within the broader trend—or signals the start of deeper downside.
Gold Price Up More Than 435% Since 2015 as Long-Term Bull Trend Remains Intact
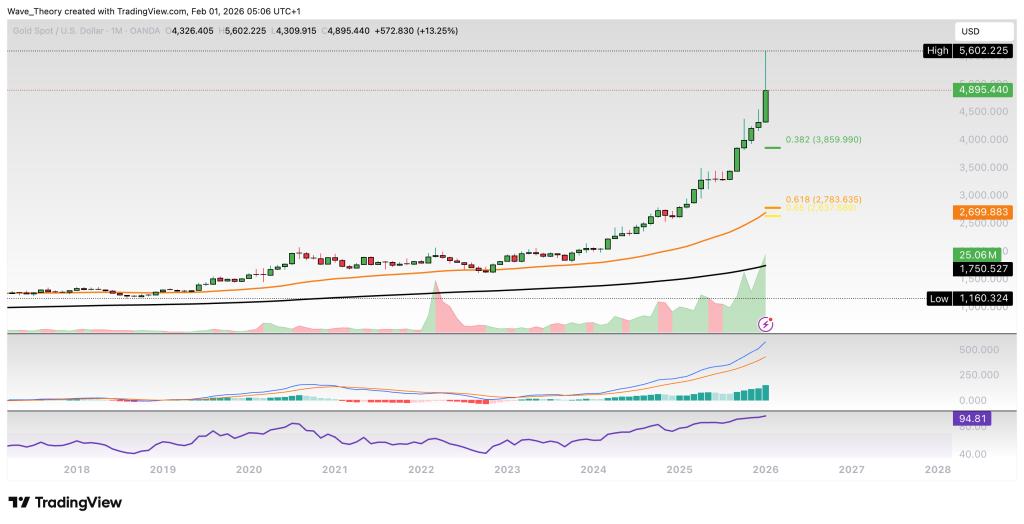
Since 2015, the gold price has surged by over 435%, following a prolonged sideways phase between 2015 and 2018. From 2018 to 2020, gold entered a moderate advance, rising from approximately $1,160 to $2,075. During the Covid period, price corrected until it found support at the 50-month EMA in 2022 around $1,660. From that level, gold has embarked on a powerful expansionary cycle, gaining roughly 247% and ultimately printing a new all-time high at $5,602 this Thursday.
From a technical perspective, monthly indicators remain decisively bullish. The EMAs have formed a golden crossover, confirming the long-term uptrend, while the MACD lines are bullishly crossed and the MACD histogram has been trending bullishly higher for several months. The RSI is positioned in overbought territory, yet continues to show no bearish signals, consistent with a strong trending environment rather than exhaustion.
To keep the broader uptrend structurally intact, gold needs to hold above the key golden ratio support near $2,700, where the 50-month EMA provides additional confluence and long-term support.
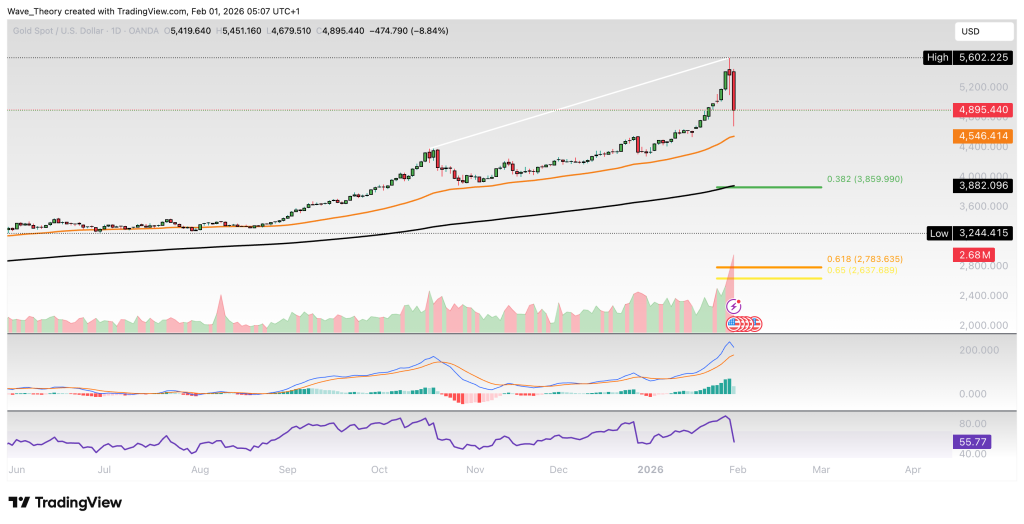
Gold Approaches Key Support at the 50-Day EMA as Daily Momentum Softens
For now, gold is finding significant support at the 50-day EMA around $4,546. Despite the sharp sell-off, daily indicators remain predominantly bullish: both the MACD lines and the EMAs are bullishly crossed, confirming that the short- to medium-term trend structure remains intact. That said, momentum has started to cool, with the RSI positioned in neutral territory and the MACD histogram beginning to tick bearishly lower, reflecting the impact of the recent single-session decline.
Summary & Key Levels
Gold has entered a sharp corrective phase after a powerful multi-year and parabolic advance, dropping 16.5% on the week and 14% in a single session, yet the broader trend structure remains bullish across higher timeframes. While short-term momentum has weakened—evidenced by bearish RSI divergences and a softening MACD—trend-defining EMAs and long-term momentum indicators continue to support the case for a correction rather than a confirmed trend reversal.
Key levels to watch:
-
Immediate support: $4,684 (200-4H EMA), $4,546 (50-day EMA)
-
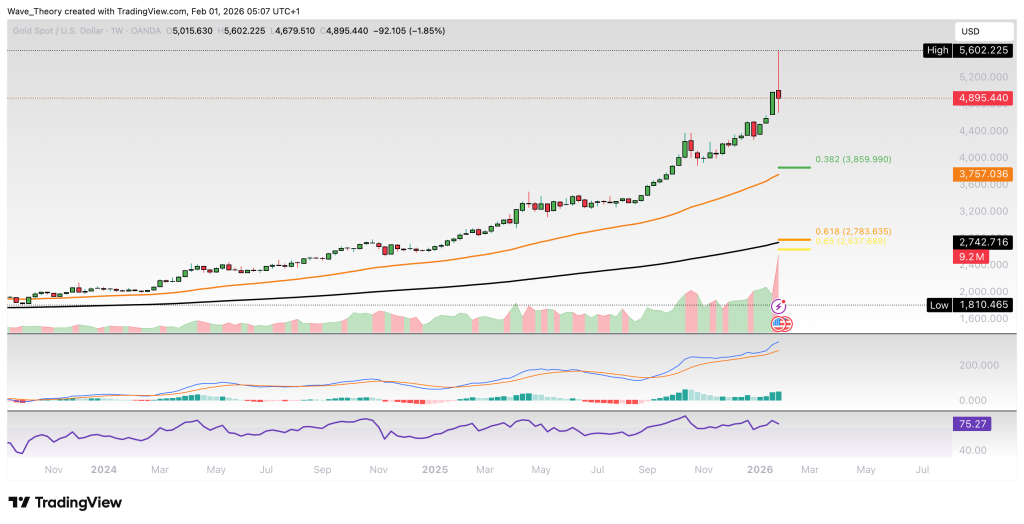
Major support zones: $3,760 (50-day / 200-day EMA confluence, 0.382 Fib), $2,742 (golden ratio support)
-
Resistance: $5,067 (50-4H EMA), $5,602 (all-time high)
A sustained hold above the $3,760–$2,742 support zone would favor stabilization and a potential resumption of the primary uptrend, while a decisive break below this area would significantly increase the probability of a bear trend.
- Check out our free forex signals
- Follow the top economic events on FX Leaders economic calendar
- Trade better, discover more Forex Trading Strategies
- Open a FREE Trading Account
- Read our latest reviews on: Avatrade, Exness, HFM and XM