Palantir (PLTR) Poised for a Bounce After 38% Correction

Quick overview
- Palantir Technologies (PLTR) has declined approximately 38% from its recent highs, currently testing critical Fibonacci support at $130.5.
- The stock's bearish structure is reinforced by a breakdown below the 50-week EMA and the formation of death crosses on lower timeframes.
- Despite the prevailing bearish trend, early signs of momentum stabilization are emerging, suggesting a potential short-term bullish bounce.
- If key support levels at $130.5 and $125.4 fail, the next major downside target is the 50-month EMA near $75.
Palantir Technologies (PLTR stock) has already declined approximately 38% from its recent highs. With downside momentum showing signs of exhaustion, the stock is now approaching conditions that could support a technical rebound. The key question is whether Palantir is positioning itself for the next upward leg.
Palantir Technologies: Testing Key Fibonacci Support After a 38% Correction
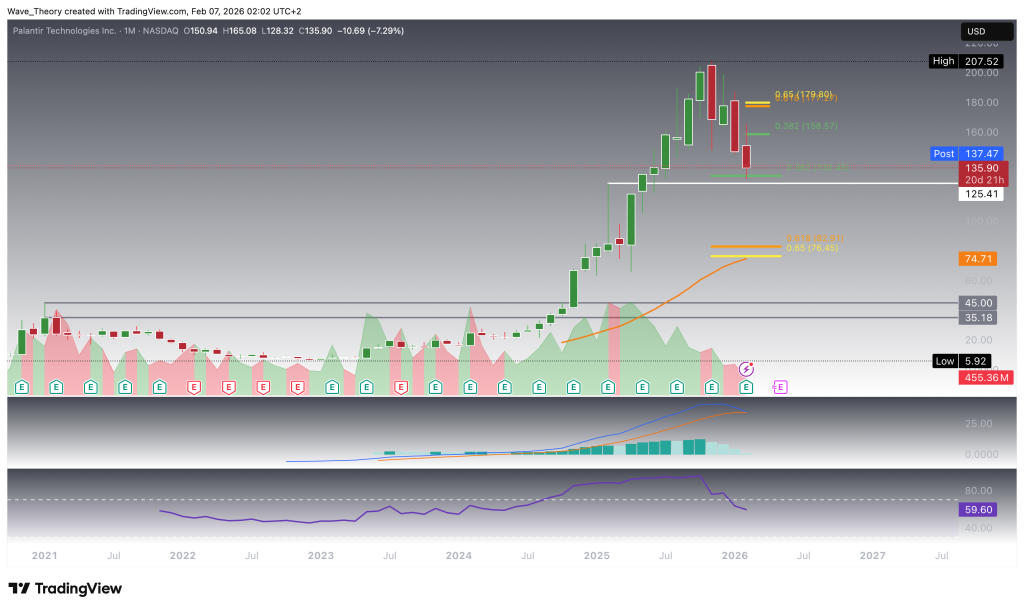
Palantir Technologies has reached a critical technical inflection point, currently testing the 0.382 Fibonacci retracement support at $130.5. From this level, the stock could stage a bullish reaction, with upside targets located at the next Fibonacci resistance levels at $158.6 and $175. However, unless Palantir decisively reclaims and breaks above the golden ratio resistance at $175, the broader corrective structure remains technically bearish.
Notably, the stock has already declined approximately 38% from its all-time high at $207.5, placing it deep into a corrective phase. Should the 0.382 Fibonacci support at $130.5 fail, the next layer of downside protection is provided by horizontal support at $125.4.
From a momentum perspective, downside risks remain present. The MACD histogram has been ticking lower for the past four months, signaling sustained bearish momentum, while the MACD lines are approaching a potential bearish crossover. Meanwhile, the RSI remains neutral, indicating neither oversold nor overbought conditions at this stage.
If both the $130.5 Fibonacci support and the $125.4 horizontal support fail to hold, the next major downside target resides at the 50-month EMA near $75. This level is technically significant, as it coincides with the golden ratio, creating a strong zone of confluence. As long as Palantir holds above this area, the primary long-term uptrend remains structurally intact, despite the ongoing correction.
Palantir Technologies: 22.3% Weekly Sell-Off Breaks Key EMA Support
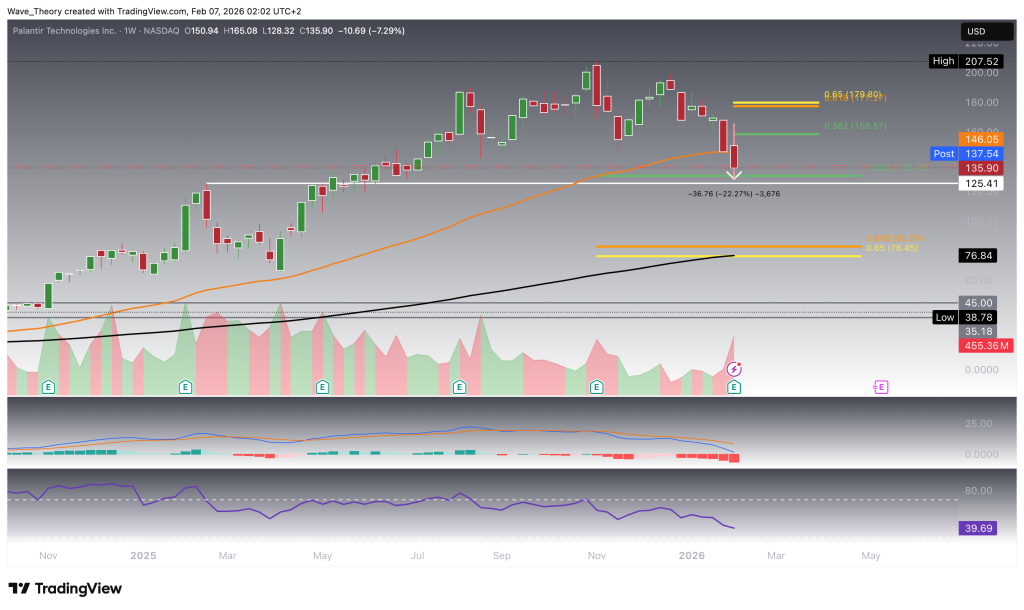
On the weekly chart, Palantir Technologies experienced a sharp decline of approximately 22.3% in a single week. This aggressive sell-off resulted in a bearish break below the 50-week EMA at $146, signaling increased downside pressure in the near term.
Despite this breakdown, the exponential moving averages remain in a golden crossover configuration, which continues to confirm a bullish mid-term trend structure. However, momentum indicators paint a more cautious picture. The MACD is flashing clear bearish signals, with the MACD lines bearishly crossed and the MACD histogram trending decisively lower, reflecting strengthening downside momentum. Meanwhile, the RSI remains in neutral territory, suggesting that the stock is neither oversold nor exhibiting meaningful bullish divergence at this stage.
Palantir Technologies: Daily Chart Approaches Potential Death Cross
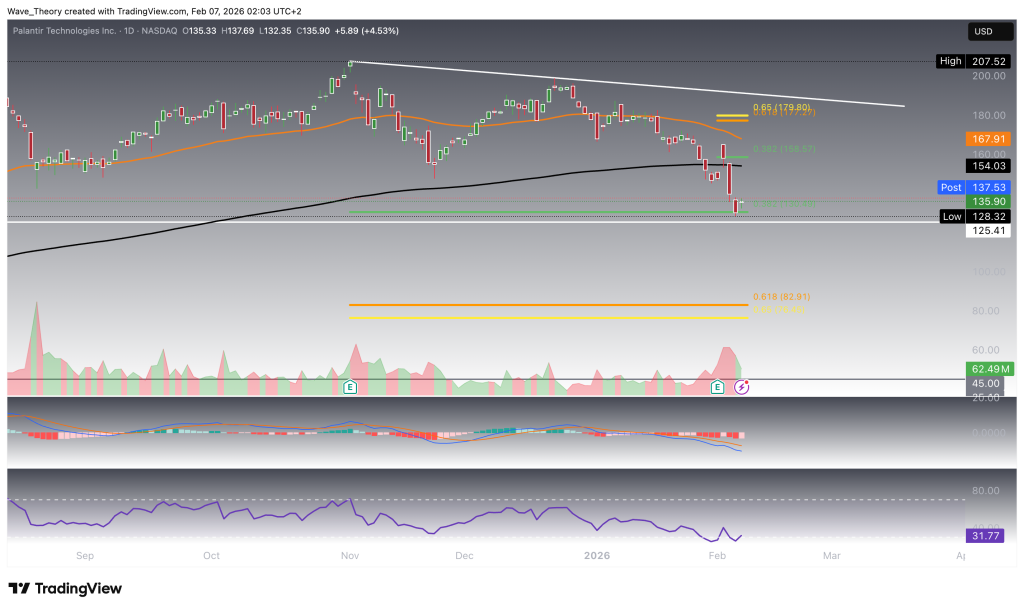
On the daily chart, Palantir Technologies’ exponential moving averages are approaching a potential death cross, which—if confirmed—would validate a bearish trend in the short- to medium-term. Structurally, the stock has already established a lower high and a lower low, reinforcing the prevailing bearish bias.
Momentum indicators, however, are beginning to show early signs of stabilization. The MACD lines have already crossed bearishly, yet the MACD histogram has started to tick higher today, indicating waning downside momentum. This shift aligns with price action testing the 0.382 Fibonacci support at $130.5, a level from which the stock could attempt a bullish rebound in the coming week.
Adding to this short-term constructive setup, the RSI is printing a minor bullish divergence, suggesting improving momentum beneath the surface and lending support to a near-term bullish counter-move, despite the broader bearish structure.
Palantir (PLTR)
Palantir Technologies: Death Cross Confirmed on the 4H Chart
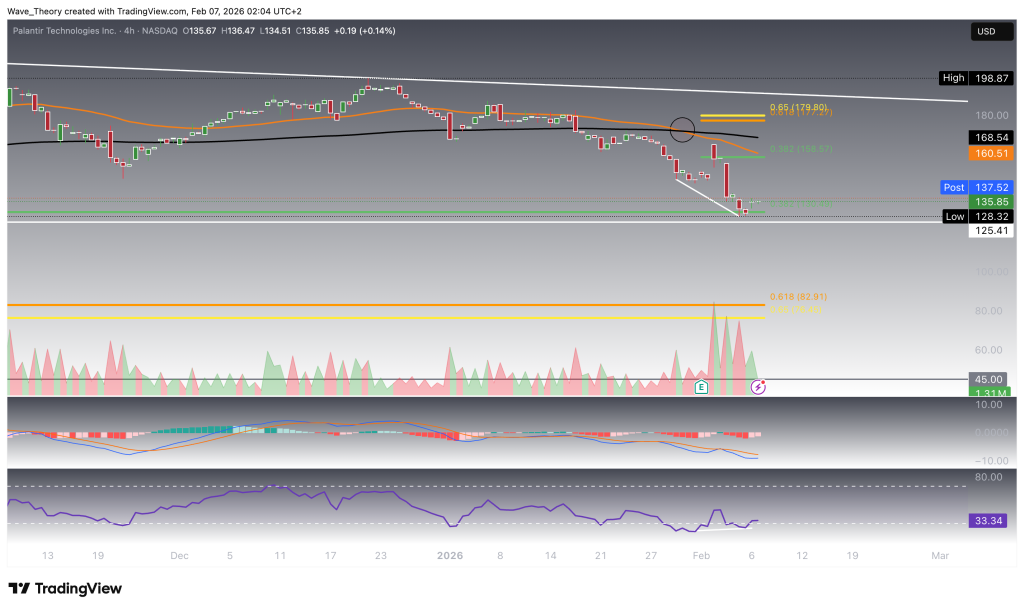
On the 4-hour chart, Palantir Technologies’ exponential moving averages have already formed a death cross, confirming a bearish short-term trend. In line with this, the MACD lines remain bearishly crossed, reinforcing prevailing downside pressure.
However, early signs of momentum stabilization are emerging. The MACD histogram has begun to tick higher, indicating a reduction in bearish momentum, while the RSI is printing a bullish divergence, suggesting improving underlying strength. As a result, Palantir retains the potential to initiate a short-term bullish bounce, with upside targets aligned at the 0.382 Fibonacci resistance at $158.6 and, in an extended recovery scenario, the golden ratio resistance at $175.
Palantir Technologies – Technical Summary & Key Levels
Palantir remains in a broader corrective phase after a 38% decline from its $207.5 ATH, with bearish structure confirmed across the weekly, daily, and 4H timeframes. The weekly breakdown below the 50-week EMA at $146 and the emergence of death crosses on lower timeframes reinforce short-term downside pressure. Momentum indicators remain mixed: while the MACD is bearishly crossed on higher timeframes, the MACD histogram and RSI are showing early bullish divergences on the daily and 4H charts, suggesting a potential near-term stabilization.
Price is currently testing critical 0.382 Fibonacci support at $130.5, with additional horizontal support at $125.4. A successful hold of this zone could trigger a short-term bullish bounce, targeting $158.6 (0.382 Fib resistance) and potentially $175 (golden ratio resistance). However, failure to reclaim $175 keeps the correction structurally bearish.
If both $130.5 and $125.4 fail to hold, the next major downside level lies at the 50-month EMA near $75, which coincides with the golden ratio and represents a key level for maintaining the long-term uptrend structure.
Key Levels
- Resistance: $158.6 → $175
- Support: $130.5 → $125.4 → $75
- Structural Pivot: $175 (trend invalidation level)
- Check out our free forex signals
- Follow the top economic events on FX Leaders economic calendar
- Trade better, discover more Forex Trading Strategies
- Open a FREE Trading Account
- Read our latest reviews on: Avatrade, Exness, HFM and XM
Related Articles


Sidebar rates
Related Posts
