Seagate Technology Stock (STX) Up 627% Since April

Quick overview
- Seagate Technology (STX) has experienced a remarkable 627% increase since April of last year, reaching an all-time high of $459.41.
- Despite the strong long-term uptrend, there are signs of potential near-term correction, with bearish divergences appearing in momentum indicators.
- Key support levels are identified between $332 and $355, where a bullish reaction is expected if the stock retraces.
- The previous all-time high at $459.41 serves as the primary resistance level once the correction concludes.
Seagate Technology stock (STX) has delivered an exceptional rally over the past ten months, surging by more than 627% since April of last year. With the stock deep into an extended uptrend, the focus now turns to whether this momentum can be sustained or if a technical correction is beginning to take shape.
Seagate Technology (STX): Breaks to New All-Time High as Long-Term Uptrend Accelerates
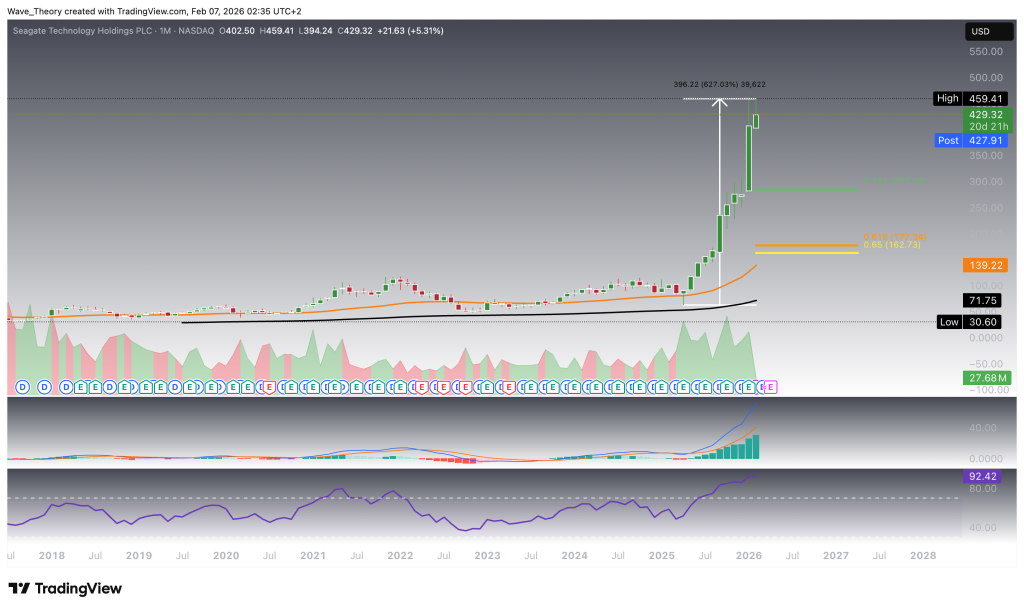
Seagate Technology has reached a new all-time high at $459.41, supported by broad-based bullish technical signals. On the monthly chart, the exponential moving averages are positioned in a golden crossover, confirming a bullish long-term trend structure.
Momentum indicators remain firmly constructive. The MACD lines are bullishly crossed, while the MACD histogram is trending decisively higher, reflecting sustained upside momentum. At the same time, the RSI is positioned in strongly overbought territory, underscoring the strength of the ongoing advance rather than signaling immediate weakness.
Since correcting down to the 50-month EMA in April of last year, Seagate (STX) has delivered an exceptional rally of approximately 627%, reinforcing the dominance of the long-term uptrend despite the extended nature of the move.
Seagate Technology (STX): Up 65% Year-to-Date as Bullish Momentum Persists
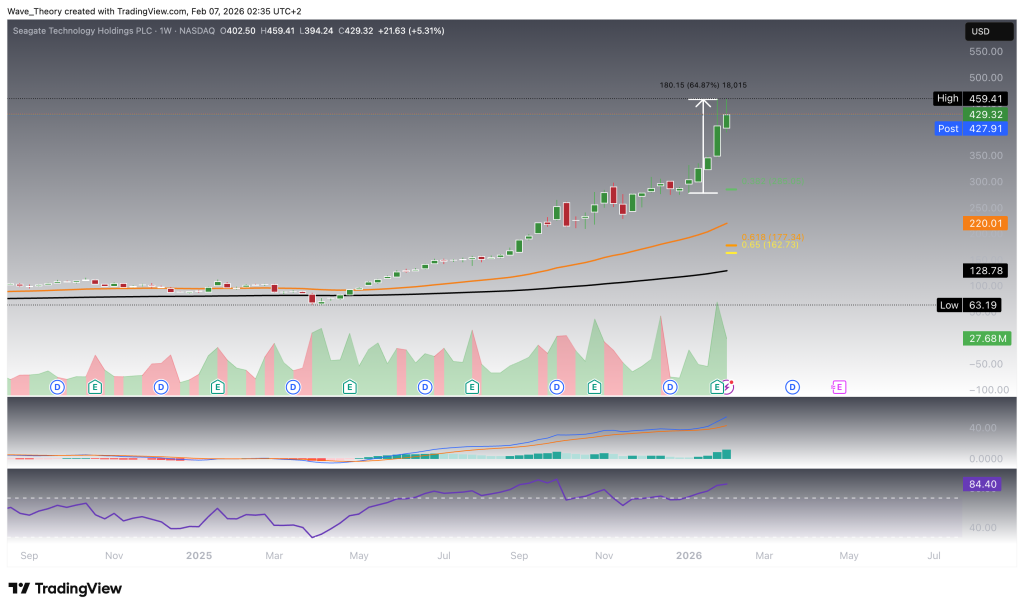
Seagate Technology is up approximately 65% year-to-date, reflecting sustained upside momentum. On the weekly chart, technical indicators remain predominantly bullish. The exponential moving averages are positioned in a golden crossover, confirming a bullish mid-term trend structure.
Momentum indicators continue to support the advance. The MACD lines are bullishly crossed, while the MACD histogram has been ticking higher for the past four weeks, signaling strengthening upside momentum. Meanwhile, the RSI is trading in overbought territory, yet shows no bearish divergence or reversal signals, indicating that momentum remains intact rather than exhausted.
Seagate Technology (STX): Near-Term Correction Risk Despite Dominant Uptrend
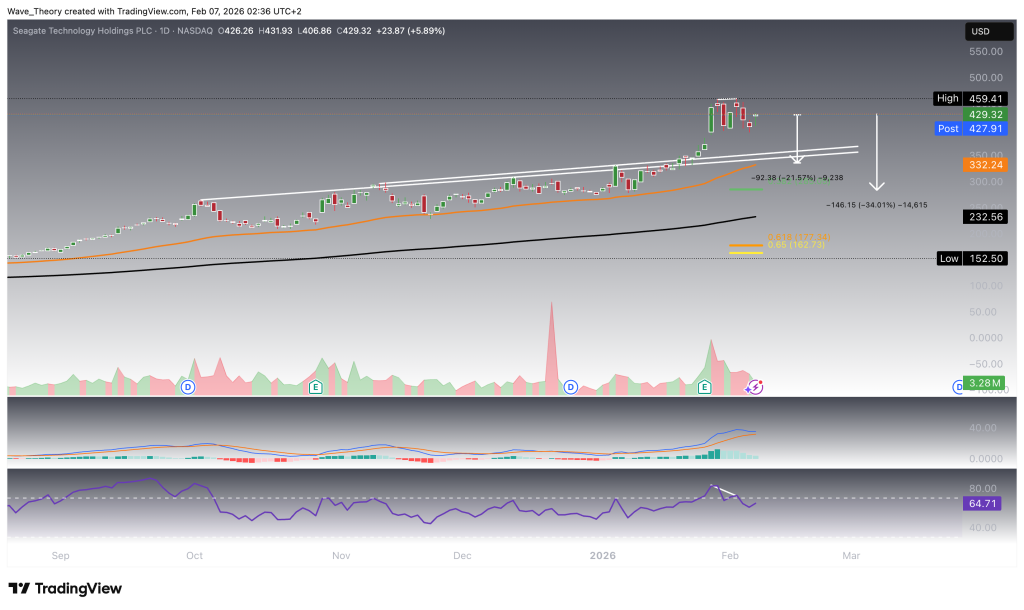
On the daily chart, Seagate Technology is facing immediate downside risk after the RSI printed a bearish divergence, which has already been followed by a downward price reaction. Momentum indicators are beginning to weaken further, as the MACD histogram has been printing progressively lower bars for an extended period, raising the likelihood of a bearish MACD crossover in the near term.
Should the corrective move extend, Seagate encounters significant confluence support along the rising trendline slightly above the 50-day EMA, located between $332 and $355. A move into this zone would imply downside potential of approximately 21.6%, from where the stock could stabilize and bounce bullishly to resume its broader uptrend.
Below this area, the 200-day EMA at $232 represents the next major technical support, implying downside potential of roughly 34%. A break to this level would still be corrective in nature but would mark a deeper retracement within the prevailing uptrend.
In a more extreme downside scenario, major golden ratio support is located at $165. As long as Seagate holds above this level, the long-term uptrend remains structurally intact. At this stage, however, a correction of that magnitude appears highly unlikely. Instead, a retracement toward the 50-day EMA and trendline support between $332 and $355 appears to be the most probable scenario, with scope for renewed upside momentum emerging thereafter, potentially as early as next week.
To the upside, no meaningful resistance levels remain overhead, aside from the previous all-time high at $459.41, which continues to serve as the primary upside reference point.
Seagate Technology (STX): 4H Chart Confirms Near-Term Pullback Within a Bullish Structure
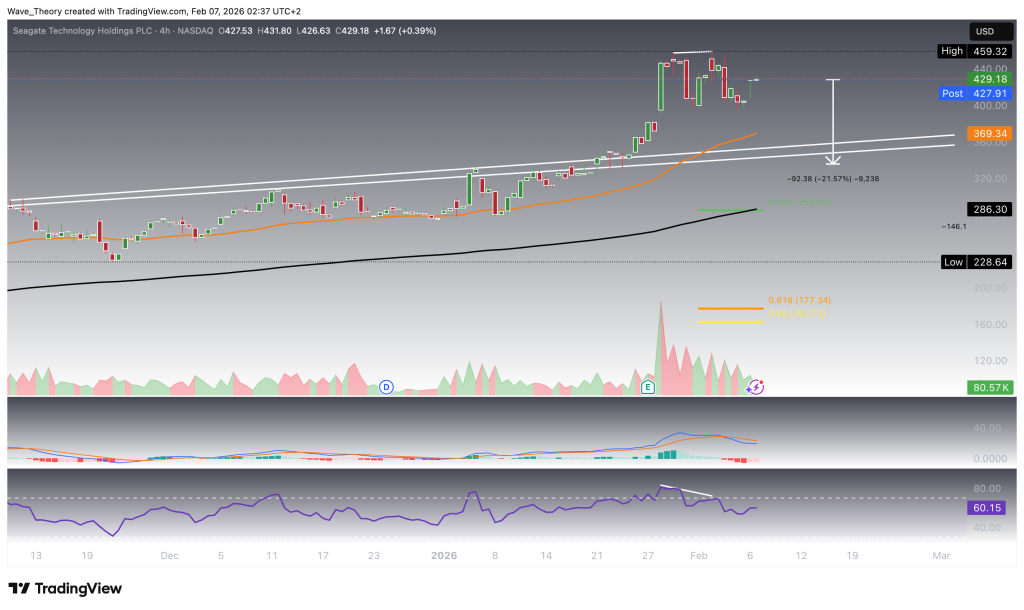
The 4-hour chart largely mirrors the daily setup. The RSI is printing a bearish divergence, signaling near-term downside risk, while the exponential moving averages remain in a golden crossover, continuing to confirm a bullish short-term trend structure.
Momentum indicators are mixed. The MACD lines have already crossed bearishly, indicating short-term weakness; however, the MACD histogram is currently ticking higher, suggesting that bearish momentum is beginning to ease.
Should Seagate extend its corrective move, the next key support is located at the 50-period EMA on the 4H chart at $369.3, where price may stabilize before attempting to resume the broader uptrend.
Seagate Technology (STX) – Technical Summary & Key Levels
Seagate Technology remains in a dominant long-term uptrend, highlighted by a 627% advance since the April 2025 low at the 50-month EMA, a 65% gain year-to-date, and a recent all-time high at $459.41. Higher timeframes remain structurally bullish, with golden EMA crossovers across all timeframes, supported by bullishly crossed MACD lines and sustained momentum.
In the near term, however, momentum is showing signs of fatigue. The daily and 4H charts both display bearish RSI divergences, and the daily MACD histogram has been weakening, with a potential bearish crossover developing. This points to an increased probability of a healthy corrective pullback rather than trend reversal.
The most likely downside target lies at trendline support near the 50-day EMA between $332 and $355, implying ~21.6% downside, where a bullish reaction and trend continuation are expected. On the 4H chart, interim support is located at the 50-4H-EMA at $369.3. Deeper support resides at the 200-day EMA at $232 (~34% downside), while major golden ratio support at $165 defines the level above which the long-term uptrend remains structurally intact—a move to this area currently appears unlikely.
To the upside, overhead resistance is limited, with the previous all-time high at $459.41 remaining the primary reference level once the correction is complete.
Key Levels
- Resistance: $459.41 (ATH)
- Near-Term Support: $369.3 (50-4H-EMA)
- Primary Support Zone: $332–$355 (50-day EMA & trendline)
- Major Support: $232 (200-day EMA)
- Structural Support: $165 (golden ratio)
- Check out our free forex signals
- Follow the top economic events on FX Leaders economic calendar
- Trade better, discover more Forex Trading Strategies
- Open a FREE Trading Account
- Read our latest reviews on: Avatrade, Exness, HFM and XM