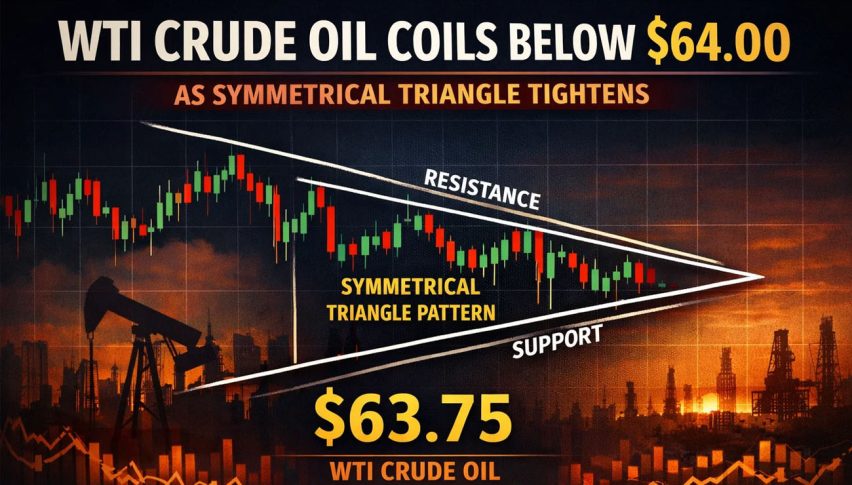
WTI Crude Oil Coils Below $64.00 as Symmetrical Triangle Tightens
WTI crude oil is experiencing a tight trading range on the 1-hour chart. On February 9, 2026, prices are moving between $63.00 and $63.40...
Quick overview
- WTI crude oil is trading within a tight range of $63.00 to $63.40, forming a symmetrical triangle pattern on the 1-hour chart.
- Technical indicators suggest market indecision, with the RSI near 50 and candlestick patterns showing small bodies and long wicks.
- Recent geopolitical developments have eased tensions, contributing to a drop in prices from $66.00, while a global supply surplus limits downside risk.
- Traders should consider selling on a confirmed close below $62.60, targeting $61.20, with a stop loss above $63.90.
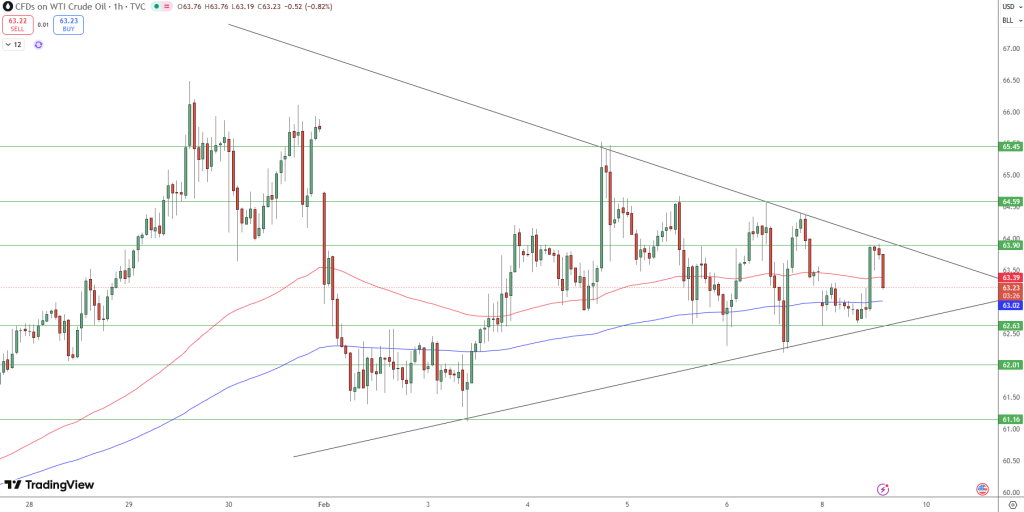
WTI crude oil is experiencing a tight trading range on the 1-hour chart. On February 9, 2026, prices are moving between $63.00 and $63.40, forming a symmetrical triangle pattern. This setup shows a battle between buyers and sellers as the market considers easing geopolitical tensions and ongoing supply surplus.
Technical Overview: Volatility Near the Apex
On the 1-hour chart, the range is narrowing, with lower highs since the $65.45 peak and higher lows from the $61.15 base. This has pushed prices just below the 50-period moving average, which now acts as resistance.
Key technical indicators further support this consolidation:
- Candlestick Patterns: Recent candles have small bodies and long wicks, showing that the market is undecided and trend momentum is fading for now.
- RSI (Relative Strength Index): The RSI is steady near 50, which shows there is no clear direction. The market seems to be waiting for a new event to set the next move.
- Fibonacci Levels: Prices are hovering around the 38.2% retracement from the last move down, making the $63.20–$63.40 area an important decision point.
Fundamental Drivers: Diplomacy vs. Surplus
The main reason for the recent drop from $66.00 is a change in the geopolitical situation. Early Monday reports say that indirect U.S.-Iran nuclear talks in Oman were called a “good start,” which has reduced the “war premium” that kept prices high in January.
Still, downside risk is limited by infrastructure worries. The Strait of Hormuz is key for traders since about 20-25% of global oil moves through it. If tensions rise suddenly, the current bearish outlook could quickly change, pushing WTI back toward $70.00.
Critical Levels to Watch
Traders should monitor these specific price levels to identify the direction of the eventual breakout:
Trade Idea: The Bearish Breakdown
With a global surplus of 2.8 million barrels per day expected in 2026, prices are more likely to fall unless there is a major supply disruption.
- Entry: Sell on a confirmed 1-hour candle close below $62.60.
- Target: $61.20 (aligning with the late January base).
- Stop Loss: Place above $63.90 to guard against a false breakdown and a move back to the top of the triangle.
As the triangle pattern nears its end, a sharp move is likely. Traders should watch out for false breakouts and check for strong volume before acting on any move outside the triangle.
- Check out our free forex signals
- Follow the top economic events on FX Leaders economic calendar
- Trade better, discover more Forex Trading Strategies
- Open a FREE Trading Account
- Read our latest reviews on: Avatrade, Exness, HFM and XM
Related Articles
Sidebar rates
Related Posts
