Robinhood (HOOD) has come under heavy pressure amid the broader crypto market capitulation, mirroring the sharp drawdown in Bitcoin and related digital asset proxies. Since topping out, the stock has retraced approximately 53%, reflecting both sentiment-driven liquidation and elevated correlation to crypto volumes. With momentum stretched and positioning increasingly one-sided, the key question now is whether this sell-off is approaching exhaustion — or if further downside remains before a sustainable reversal can unfold.
Robinhood (HOOD) Stock Crashes 53% — Is a Major Rebound Coming?
•
Last updated: Thursday, February 12, 2026

Quick overview
- Robinhood (HOOD) has experienced a significant decline of over 53% from its all-time high, reflecting broader market pressures.
- The stock is currently testing a critical support zone between $78 and $85, which could determine its near-term price action.
- If the support fails, the next major level to watch is the golden ratio at $60, which could signal a structural trend reversal.
- Despite the bearish momentum indicators, there are early signs of potential stabilization that warrant close monitoring.
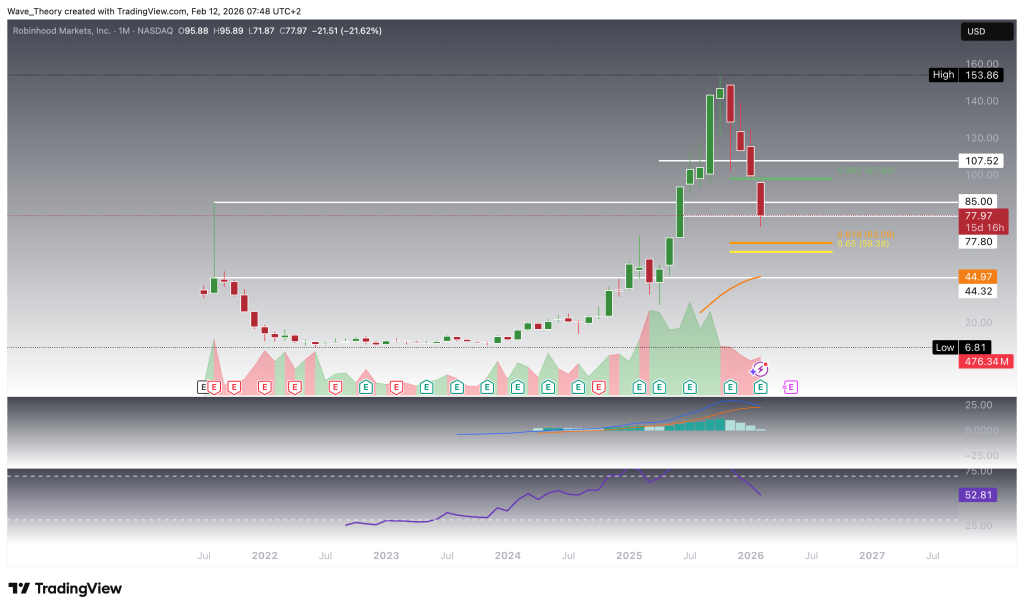
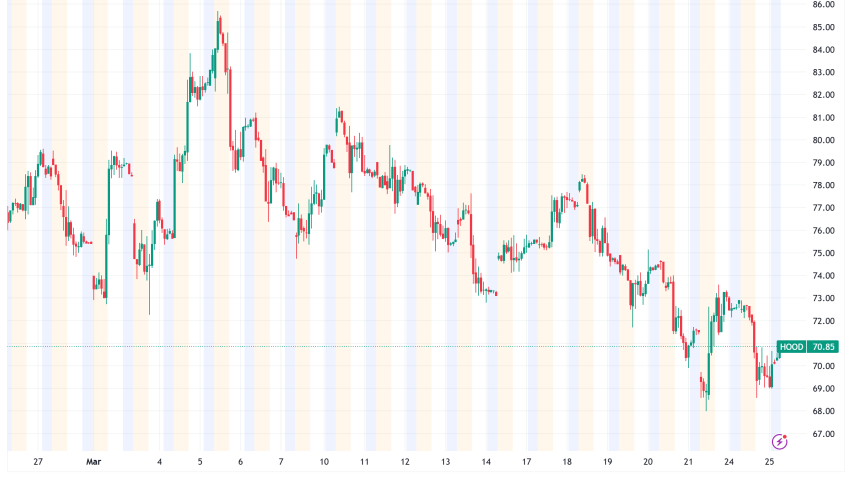
Robinhood (HOOD) has undergone a pronounced corrective phase over the past four months, declining from its all-time high near $154 to approximately $72 — effectively cutting the stock price in half. From a technical standpoint, this represents a decisive 53% retracement and a material shift in momentum structure.
During the decline, HOOD broke cleanly below the 0.382 Fibonacci retracement level at $98, signaling that the correction was evolving beyond a shallow pullback. The stock has now entered a critical demand zone between $78 and $85, an area of prior structural support where a technical bounce could emerge. This region represents the first meaningful attempt by bulls to stabilize price action following the accelerated sell-off.
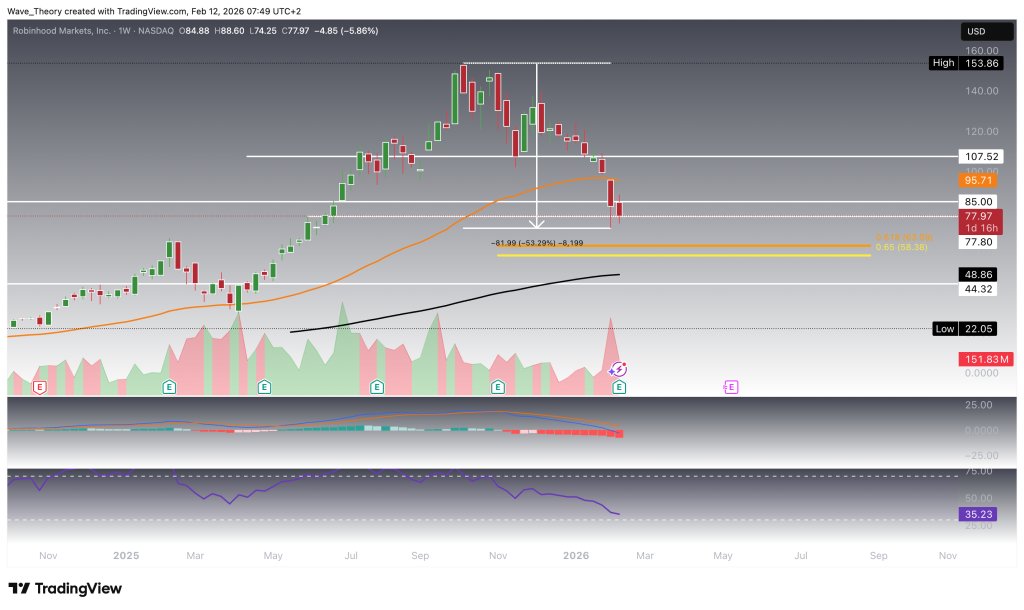
Momentum indicators, however, remain fragile. The MACD histogram has been printing progressively lower readings for four consecutive months, reflecting sustained downside momentum. As a result, the MACD lines are on the verge of a bearish crossover, which would confirm medium-term momentum deterioration. Meanwhile, the RSI is hovering in neutral territory, suggesting that the stock is not yet deeply oversold and therefore retains room for further downside should selling pressure persist.
If the $78–$85 support band fails to hold, the next major Fibonacci confluence sits at the golden ratio retracement near $60. This level represents a structurally significant inflection point and would likely be viewed as a high-probability accumulation zone for longer-term bulls. As long as price action remains above $60, the broader uptrend structure remains technically intact despite the depth of the correction.
A sustained breakdown below the $60 golden ratio support, however, would materially alter the technical landscape. In that scenario, Robinhood would likely transition into a new cyclical bear phase, with the next major downside magnet emerging at the 50-month EMA — a level that also aligns with historical resistance-turned-support around the 2021 highs. That confluence would represent the next structural anchor in a deeper retracement scenario.
In summary, HOOD is currently testing a critical decision zone. A stabilization within $78–$85 could trigger a reflexive recovery, but failure there shifts focus toward $60 as the defining line between corrective consolidation and structural trend reversal.
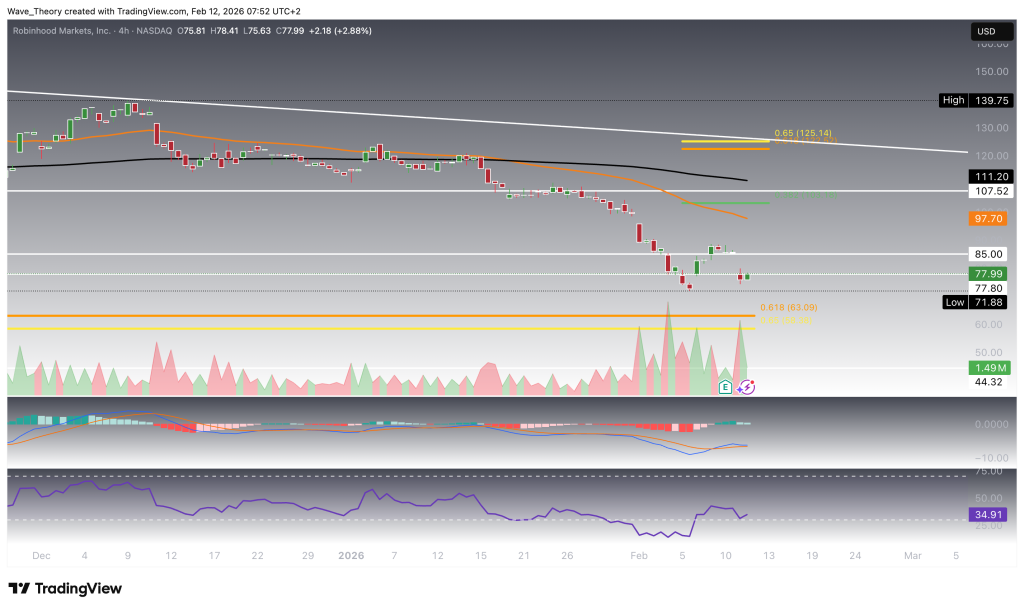
Death Cross Confirmed on the 4-Hour Chart
On the 4-hour timeframe, the EMAs have already formed a confirmed death cross, reinforcing the short-term bearish trend structure. This crossover signals sustained downside pressure and aligns with the broader corrective phase seen on higher timeframes.
Momentum indicators further support this cautious outlook. The MACD lines are converging toward a potential bearish crossover, while the MACD histogram continues to tick lower — reflecting building downside momentum. At the same time, the RSI remains neutral, offering neither bullish divergence nor oversold conditions that would suggest an immediate reversal.
That said, price action is now approaching a critical support zone. As the stock tests this technically significant area, the probability of a short-term relief bounce increases — particularly if momentum begins to stabilize. While the prevailing short-term trend remains bearish, the proximity to support warrants close monitoring for a potential tactical rebound.
HOOD Stock Technical Outlook – Key Levels to Watch
Robinhood has corrected more than 53% from its all-time high near $154, retracing to the low $70s and entering a pronounced multi-month correction. While the weekly EMAs still maintain a golden crossover — keeping the broader mid-term structure technically bullish — momentum has deteriorated significantly across lower timeframes.
On the downside, the critical support zone lies at $78–$85, where price is currently attempting to stabilize. A breakdown below this region would expose the golden ratio support at $60, which represents the key structural inflection point. As long as HOOD holds above $60, the broader uptrend remains intact. A sustained move below this level would shift the structure into a confirmed bear market, with the 50-month EMA and 2021 highs acting as the next major support confluence.
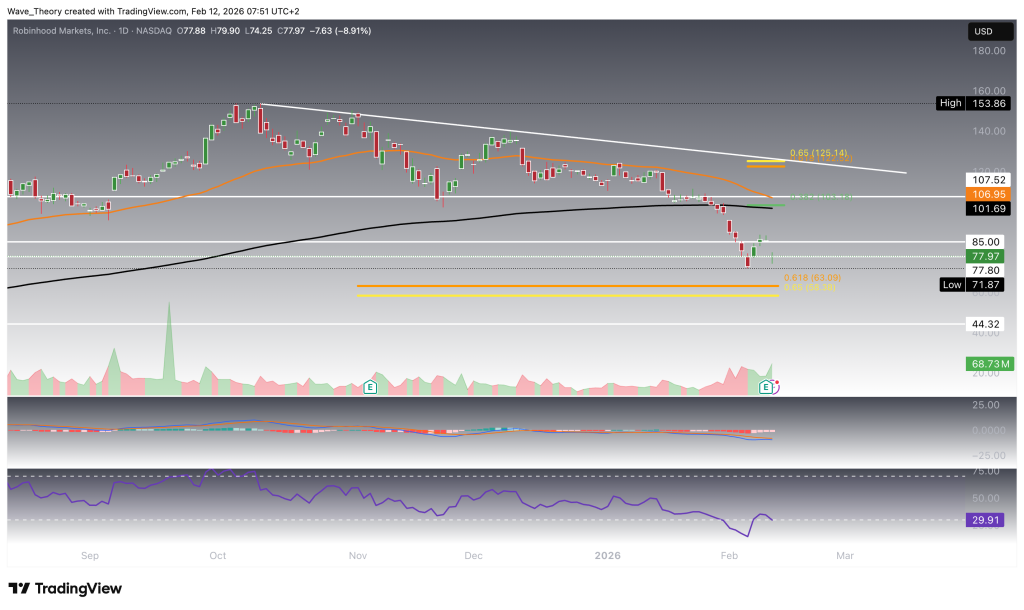
On the upside, the stock faces heavy resistance at $102–$107, where the 0.382 Fibonacci level (~$104) converges with the 50-day and 200-day EMAs. A break above this cluster would be the first signal of short-term strength. However, the broader corrective phase would only be invalidated on a decisive breakout above the $125 golden ratio resistance and descending trendline.
Short-term charts show confirmed death crosses and bearish MACD structures, though momentum is beginning to stabilize near support — increasing the probability of a tactical rebound.
Bottom line:
- Key support: $78–$85 → $60 (structural line in the sand)
- Key resistance: $102–$107 → $125
- Above $60: correction within uptrend
- Below $60: structural trend reversal into bear market
- Check out our free forex signals
- Follow the top economic events on FX Leaders economic calendar
- Trade better, discover more Forex Trading Strategies
- Open a FREE Trading Account
- Read our latest reviews on: Avatrade, Exness, HFM and XM
ABOUT THE AUTHOR
See More
Konstantin Kaiser
Financial Writer and Market Analyst
Konstantin Kaiser comes from a data science background and has significant experience in quantitative trading. His interest in technology took a notable turn in 2013 when he discovered Bitcoin and was instantly intrigued by the potential of this disruptive technology.
Related Articles


3 weeks ago
Save
Sidebar rates
Related Posts
