XRP Tests $1.30 Support: Analysts Eye “Gaussian Channel” for Sub-$1.00 Entry
Technical analysts are pointing to a potentially hazardous chart configuration that might drop XRP deep below the psychologically crucial
Quick overview
- Technical analysts warn that XRP may drop below the critical $1.00 mark, currently trading around $1.30.
- On-chain data shows significant accumulation by institutional investors, indicating a potential bullish divergence despite bearish technical signals.
- Analysts suggest three possible scenarios for XRP's future, with $1.65 being a crucial level for a bullish recovery.
- The market is at a turning point, with whale transactions and ETF inflows complicating the bearish outlook.
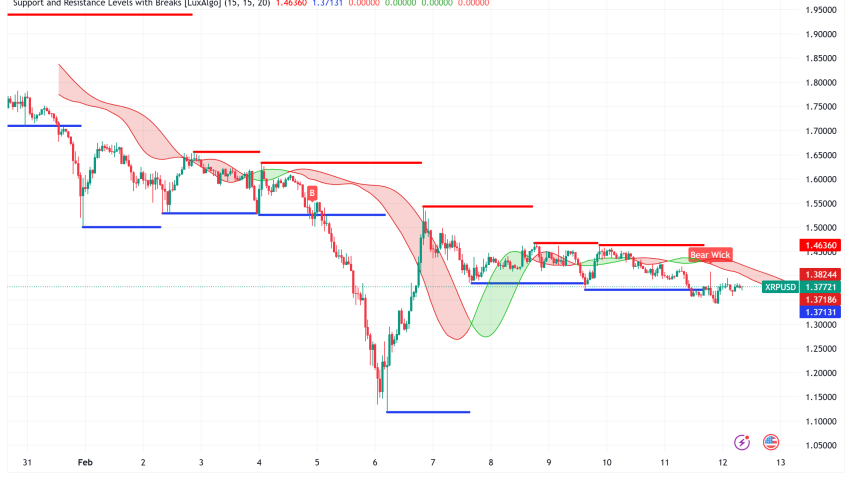
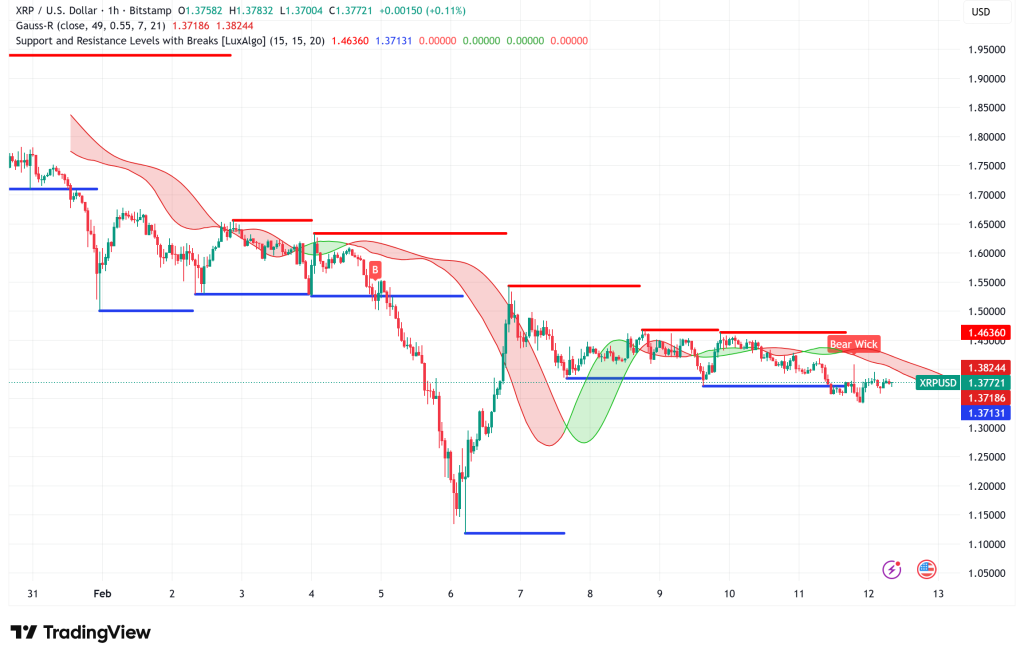
Technical analysts are pointing to a potentially hazardous chart configuration that might drop XRP XRP/USD deep below the psychologically crucial $1.00 mark, which has caused it to trade around $1.30 on Thursday, down more than 2% over the previous day. On-chain data, however, reveals a different picture: one of the biggest bull-bear divisions in XRP’s recent history is being created by institutional purchasers and high-net-worth investors who are accumulating at a rate not seen in months.
The Gaussian Channel Is Flashing a Warning XRP Investors Cannot Ignore
The monthly Gaussian Channel indicator, which detects important regression bands and gauges long-term trend momentum, provides the most somber data point. The upper regression band, which is presently trading around $1.16, is a historically hazardous juncture, and XRP has already retraced about 63% from its multi-year high of $3.66, according to analyst Chart Nerd.
Every time XRP has rallied and then retested this upper band, the price has then fallen for three to four months before finding a floor at the middle regression band. This is a concerning pattern revealed by previous fractal behavior. The middle band has never been correctly retested as support and is now trading at about $0.70, a level that also functioned as year-round resistance in 2023 and 2024.
This worry is shared by analyst Crypto Patel, who points out that although the $1.00 zone can provide aggressive buyers with a fair entry point, the “best accumulation zone” might go as low as $0.50 to $0.70. Importantly, Patel highlights the difference between the present correction and the disastrous 96% drop in 2018, indicating that a moderate but significant pullback is still the more likely scenario. Only if the price breaks below the most recent local low of $1.12, which was recorded last Friday, does Chart Nerd’s model corroborate the bearish thesis.
Wave 4 Bounce Is Real, But a Final Leg Down May Still Be Coming
CasiTrades, an Elliott Wave analyst, provides a more organized and possibly more useful approach. She believes that after last Thursday’s severe capitulation sell-off that sent the RSI to multi-year lows, XRP is currently navigating a Wave 4 relief rebound. By definition, wave 4 bounces are transient countertrend movements that occur inside a bigger corrective pattern.
The first upward goal of the initial rally has already been reached: the 0.382 Fibonacci retracement around $1.52, which also coincides with a more general macro 0.65 retracement level, forming a significant confluence resistance zone. The next level to keep an eye on is $1.65, where the macro 0.618 Fibonacci and the 0.5 retracement converge. CasiTrades clearly identifies this as the line in the sand for XRP’s short-term future.
A final impulsive Wave 5 collapse may send the price below $1.09 and possibly as low as $0.90 if XRP is unable to regain $1.65 and stall below it, according to CasiTrades. At that point, the RSI would probably form a bullish divergence, which is traditionally a high-conviction indicator for significant long-term entries. However, she emphasizes that panic selling would not be appropriate at this time because XRP would be nearing the bottom of a multi-month corrective structure and key exchange support levels would have already been tested.
Whale Accumulation and ETF Inflows Provide a Compelling Counternarrative
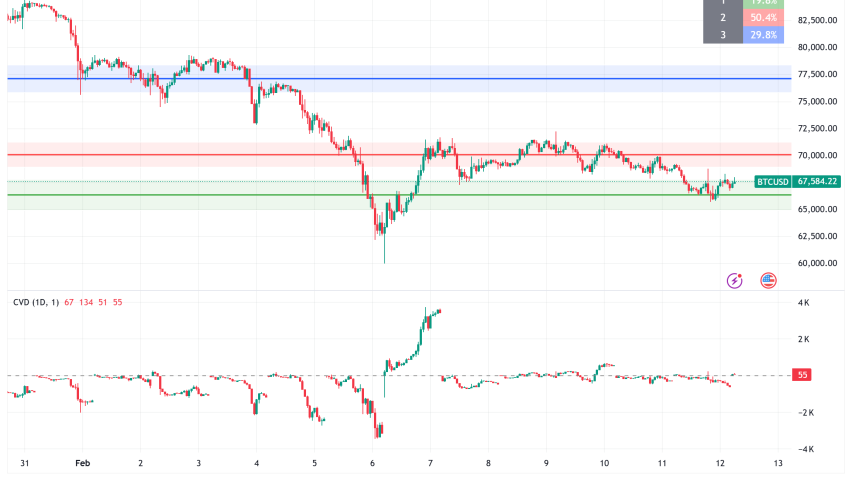
Some of the strongest on-chain signals in months complicate and may invalidate the bearish technical picture. Since their inception in late 2025, spot XRP ETFs have amassed a total of $1.23 billion in net inflows; Tuesday’s $3.26 million mark marks the fifth day in a row that flows have been positive. With $1.01 billion in total assets under management across these products, institutional conviction remains strong despite waning retail sentiment.
On-chain information is much more remarkable. High-net-worth individuals are aggressively accumulating XRP at present price levels, as seen by the rise in transactions surpassing $100,000, which reached four-month highs of 1,389 occurrences. In the meanwhile, market intelligence platform Santiment characterizes the spike in the number of active addresses on the XRP Ledger to 78,727 in a single 8-hour candle as consistent with price reversal patterns across digital assets. This is the biggest reading in six months.
Three Scenarios Traders Must Prepare For in the Coming Weeks
The overwhelming body of evidence suggests that the market is at a true turning point. Almost much of the future depends on XRP’s ability to recover and hold above $1.65.
- A clear break and hold above $1.65 in the bullish scenario would indicate that Wave 4 has developed into a more comprehensive recovery, with institutional flows confirming accumulation and structural resistance being removed, perhaps paving the way for a run back toward the $2.00–$2.50 region in the upcoming months.
- As the market awaits a macro trigger, XRP, in the base case, consolidates above the local low of $1.12 and grinds sideways between $1.20 and $1.65.
- In the bearish scenario, the asset would constitute a historically enticing long-term entry in relation to its fundamentals if it broke below $1.12, which sets off the Gaussian Channel fractal, opening the downside below $0.90 to $1.00 in the immediate term and possibly $0.70 over the next quarter.
Editorial Recommendation: $1.65 Is the Only Level That Counts Right Now
XRP at $1.30 is in a technical limbo, too low to affirm a comeback and too institutionally backed to declare a freefall. $1.65 should be viewed by traders as the pivotal point. The outlook is positively reshaped by a verified hold above it. Technical models have been pointing to a route below $0.70 for weeks, which is opened by a failure below $1.12. Whale transactions and ETF flows suggest that the smart money is preparing for the latter by subtly building up ahead of a possible final flush. This market should be watched every day, not only on an hourly basis.
- Check out our free forex signals
- Follow the top economic events on FX Leaders economic calendar
- Trade better, discover more Forex Trading Strategies
- Open a FREE Trading Account
- Read our latest reviews on: Avatrade, Exness, HFM and XM