AMD Stock Forms Bearish Double Top — Is a Major Drop Ahead?
Written by:
Konstantin Kaiser•Saturday, February 14, 2026•4 min read
•Last updated: Saturday, February 14, 2026
Quick overview
AMD has rallied over 249% in the past year, reaching an all-time high of $267 in October 2025, but has since struggled to maintain that level.
The stock has formed a bearish double top pattern, indicating potential distribution and increasing downside risk if key support levels fail.
Critical support levels to watch include $194, $185, and $149, with a breakdown below these levels suggesting a deeper correction.
To regain bullish momentum, AMD must reclaim resistance levels at $220 and $240, which would invalidate the current bearish outlook.
AMD delivered a powerful advance over the past year, rallying more than 249% and firmly establishing itself as one of the market’s top-performing large-cap semiconductor names. The uptrend culminated in a new all-time high at $267 in October 2025, marking the peak of an extended momentum cycle. However, subsequent attempts to extend beyond that high have failed, signaling potential exhaustion at elevated levels. With price action now struggling to reclaim record territory, the risk of a deeper corrective phase is increasing, and further downside cannot be ruled out.
AMD Stock Forms Bearish Double Top
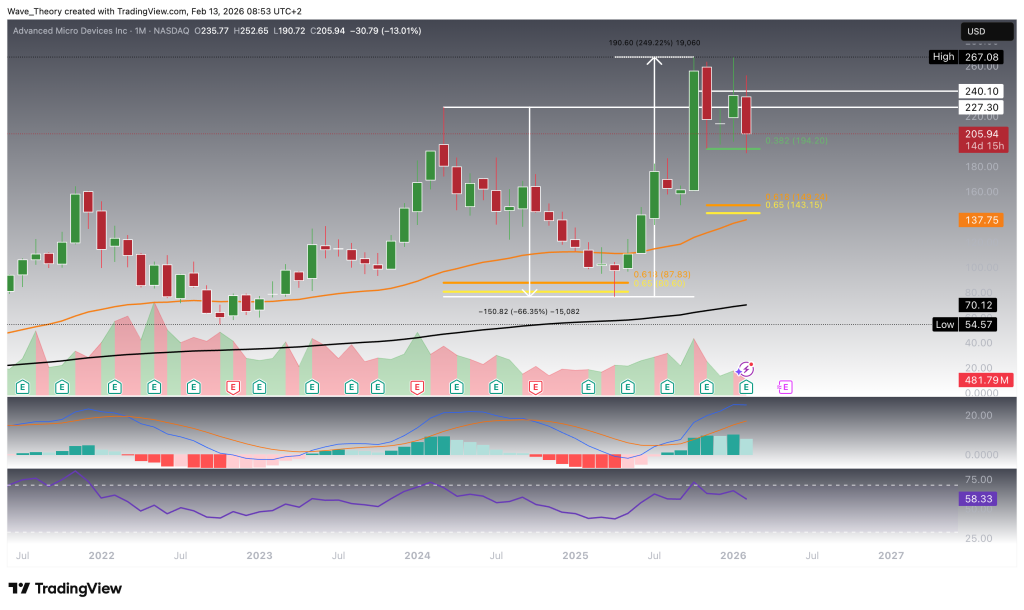
AMD previously retraced to its golden ratio support at $85, where it staged a decisive bullish rebound that ultimately fueled a remarkable 249% surge, culminating in a new all-time high at $267. From that peak, the stock corrected to the 0.382 Fibonacci support at $194, where buyers once again stepped in, driving price back toward the $267 record high.
However, the inability to break above the prior all-time high has proven technically significant. AMD has now retreated once more to the $194 (0.382 Fib) level, effectively carving out a bearish double top formation on the higher timeframe — a pattern that often signals distribution and rising downside risk if key support levels fail.
Should the $194 support give way, the next notable technical floor emerges at the 50-month EMA near $185. Beyond that, the most critical macro support zone is located between the 200-month EMA at $138 and the golden ratio retracement at $149. As long as AMD holds above the golden ratio region, the broader secular uptrend remains structurally intact. A breakdown below that zone, however, would materially damage the long-term bullish structure.
From an indicator perspective, the monthly signals present a mixed technical picture. The EMAs continue to show a golden crossover, reinforcing the long-term bullish trend bias. Conversely, the MACD lines have crossed bearishly, with the MACD histogram ticking lower for three consecutive weeks, indicating fading momentum. Meanwhile, the RSI remains in neutral territory, offering neither a bullish nor bearish divergence at present.
AMD
A 66% Drop Was Followed by a 249% Surge
AMD previously endured a sharp 66% correction, which ultimately laid the foundation for a powerful 249% recovery rally, underscoring the stock’s capacity for high-volatility cyclical swings within a broader structural uptrend.
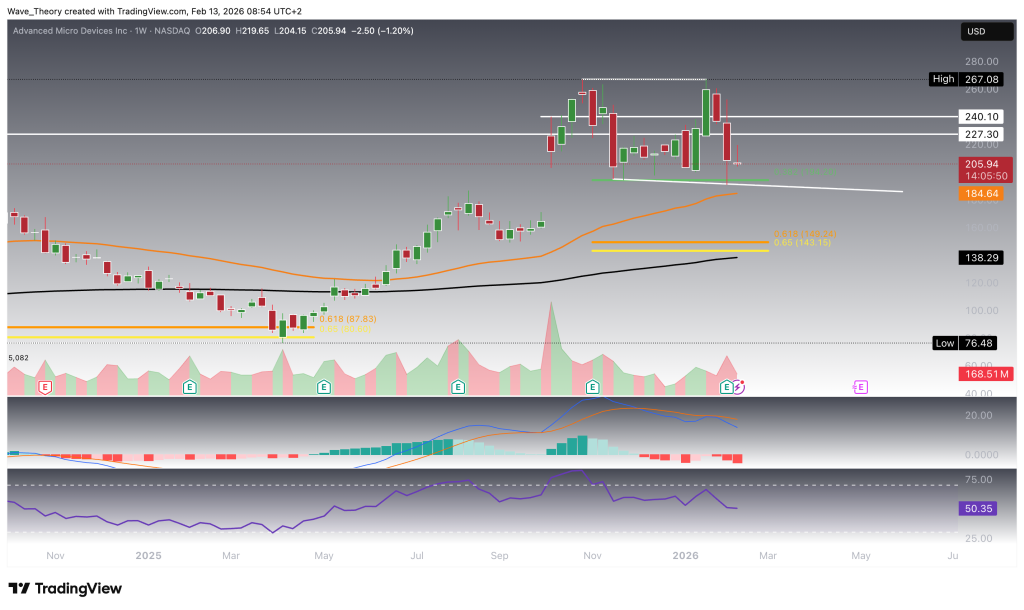
On the weekly timeframe, trend indicators remain constructive. The EMAs are still bullishly crossed, confirming the mid-term uptrend, while the MACD lines also remain in a bullish crossover configuration, reinforcing the prevailing positive structure. However, early signs of momentum fatigue are emerging, as the MACD histogram has begun ticking lower this week, signaling waning upside momentum. Meanwhile, the RSI continues to hover in neutral territory, offering no immediate directional bias.
Notably, AMD declined 24.5% this week alone, reflecting significant distribution pressure. In the context of the emerging double top formation, a decisive break below the 0.382 Fibonacci support at $194 would materially increase the probability of an extended correction. In that scenario, the next key downside target lies at the golden ratio retracement near $149. Additionally, the 50-week EMA around $138 serves as further technical support and would represent a deeper retracement zone should selling pressure accelerate.
AMD
AMD Stock Faces Rejection at Fibonacci Resistance
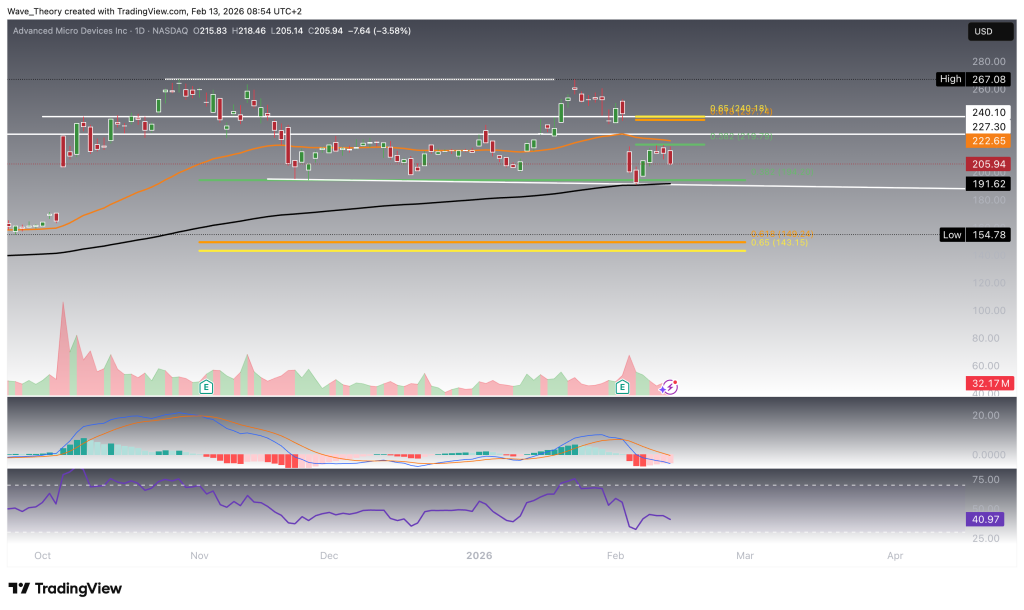
On the daily chart, AMD presents a technically mixed but still structurally constructive setup. The EMAs remain in a golden crossover, confirming the bullish trend in the short- to medium-term. Additionally, the MACD histogram is trending higher, indicating improving short-term momentum.
However, this constructive backdrop is tempered by cautionary signals. The MACD lines have crossed bearishly, suggesting underlying momentum remains vulnerable, while the RSI continues to hover in neutral territory, offering no decisive directional signal.
From a price-structure standpoint, AMD recently staged a bullish rebound from the 0.382 Fibonacci support at $194, but the recovery stalled at the next key resistance — the 0.382 Fibonacci retracement at $220. This rejection reinforces the notion that the stock remains in a corrective phase rather than resuming its primary uptrend.
To invalidate the ongoing correction, AMD must decisively reclaim both the $220 Fibonacci resistance and the golden ratio resistance near $240. A sustained breakout above these levels would significantly improve the technical outlook and reopen the path toward the prior all-time high. Until then, the broader corrective structure remains intact.
AMD
AMD Forms Series of Lower Lows and Lower Highs
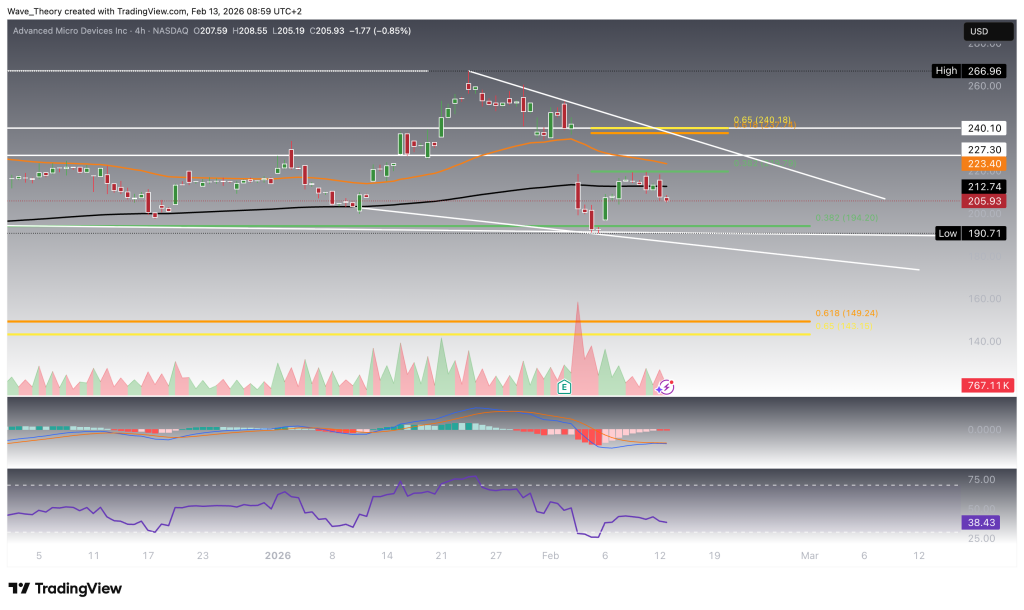
On the 4-hour chart, AMD is establishing a clear short-term downtrend structure, characterized by a sequence of lower highs and lower lows. This pattern reflects increasing distribution pressure and suggests that bearish momentum is gaining traction on the intraday timeframe.
Technically, the stock appears poised to retest the 0.382 Fibonacci support at $194, with the risk of an extension toward the golden ratio support near $149 should selling pressure persist.
Momentum indicators reinforce the near-term weakness. The MACD lines have already crossed bearishly, while the MACD histogram continues to tick lower, confirming building downside momentum. At the same time, the RSI remains in neutral territory, offering no immediate reversal signal.
Interestingly, the EMAs still display a golden crossover, which technically keeps the short-term trend structure bullishly confirmed. However, given the developing lower-high/lower-low sequence and bearish momentum signals, this bullish EMA configuration is increasingly vulnerable if key support levels fail to hold.
AMD
AMD Technical Outlook: Key Levels to Watch
AMD is showing increasing technical vulnerability after forming a bearish double top at $267, with price repeatedly failing to break to new all-time highs. While the long-term structure remains intact above major Fibonacci supports, momentum across multiple timeframes is deteriorating.
Critical Support Levels
$194 – 0.382 Fibonacci support (pivotal near-term level). A confirmed breakdown increases downside risk significantly.
$185 – 50-month EMA (intermediate support).
$149 – Golden ratio support (major structural level; key bull–bear line).
$138 – Confluence of 200-month EMA and 50-week EMA (macro support zone).
Key Resistance Levels
$220 – 0.382 Fibonacci resistance (must be reclaimed to regain short-term strength).
$240 – Golden ratio resistance (critical to invalidate correction).
$267 – All-time high (confirmation level for full bullish continuation).
Indicator Overview
Monthly: EMAs remain in a golden crossover (long-term bullish), but MACD has crossed bearishly with declining histogram momentum. RSI neutral.
Weekly: EMAs and MACD still bullishly crossed, though histogram shows early weakness. RSI neutral.
Daily & 4H: Bearish MACD crossovers and emerging lower-high/lower-low structure signal growing short-term downside pressure.
Conclusion
As long as $149 holds, AMD’s broader uptrend remains structurally intact. However, a decisive break below $194 would likely accelerate the correction toward the golden ratio zone. To invalidate the bearish double top scenario, AMD must reclaim $220 and $240, opening the door for another attempt at $267.
Konstantin Kaiser comes from a data science background and has significant experience in quantitative trading. His interest in technology took a notable turn in 2013 when he discovered Bitcoin and was instantly intrigued by the potential of this disruptive technology.