Cisco Systems (CSCO) Stock: Bullish Breakout Ahead?

Quick overview
- Cisco Systems (CSCO) is currently consolidating below the critical resistance zone of $82 to $88, which will determine its next major price direction.
- The stock has shown a strong long-term uptrend, advancing over 21% year-to-date and approximately 70% from its lows last year.
- Key support levels to watch include $69.25 and $63.37, with a loss of these levels potentially leading to a deeper corrective phase.
- A breakout above $82 could open the path for further upside toward $88 and beyond, while rejection at this level may trigger a pullback.
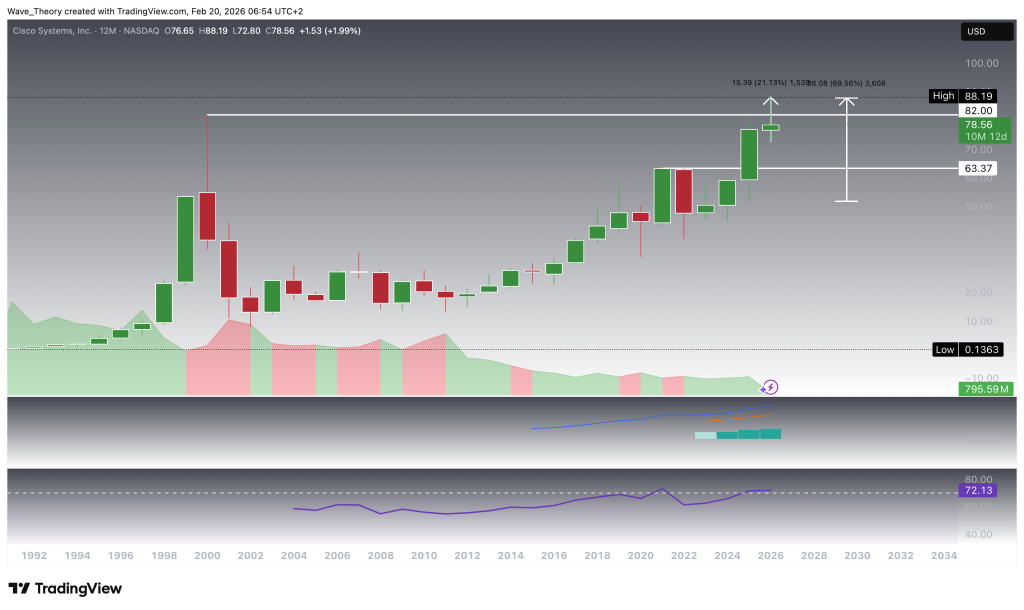
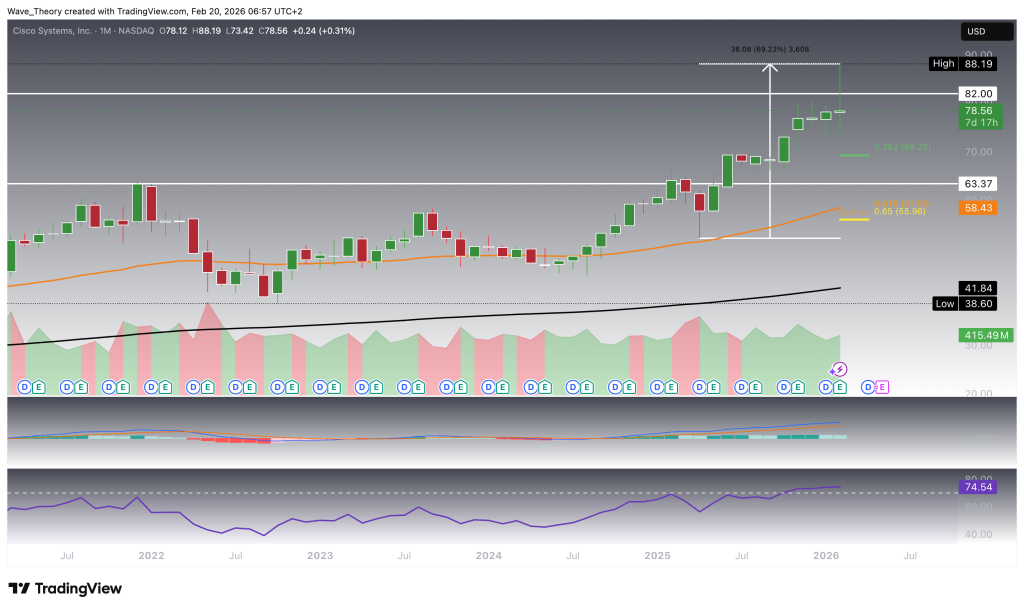
Monthly Timeframe — Compression Below $82 Resistance with Mixed Momentum Signals
On the monthly timeframe, Cisco Systems (CSCO) is currently exhibiting a clear equilibrium between bulls and bears, with price action consolidating just below the critical $82 resistance level. This compression phase reflects a market in decision mode, where a decisive breakout or rejection is likely to define the next directional move. A confirmed bullish break above $82 would open the path toward the previous high near $88.19, marking the next major upside target within the broader trend.
On the downside, the 0.382 Fibonacci retracement at approximately $69.25 serves as the first key support level, followed by the golden ratio support between $55.96 and $57.55, which is further reinforced by the 50-month EMA acting as dynamic support. This confluence area represents a critical structural floor. As long as price holds above $56, the macro bullish structure remains intact. Additionally, historical support around $63.4 provides an intermediate demand zone that could act as a buffer in the event of a deeper retracement.
From a technical indicator perspective, the picture remains mixed. The EMA structure is bullish, with a confirmed golden crossover, signaling a positive long-term trend bias. The MACD lines are also bullishly crossed, reinforcing the broader uptrend. However, the MACD histogram has been ticking bearishly lower since last month, indicating waning upside momentum and the potential for continued consolidation or short-term downside pressure. Simultaneously, the RSI has reached overbought territory, suggesting that the stock may be extended in the near term, increasing the likelihood of a cooling phase before the next directional move.
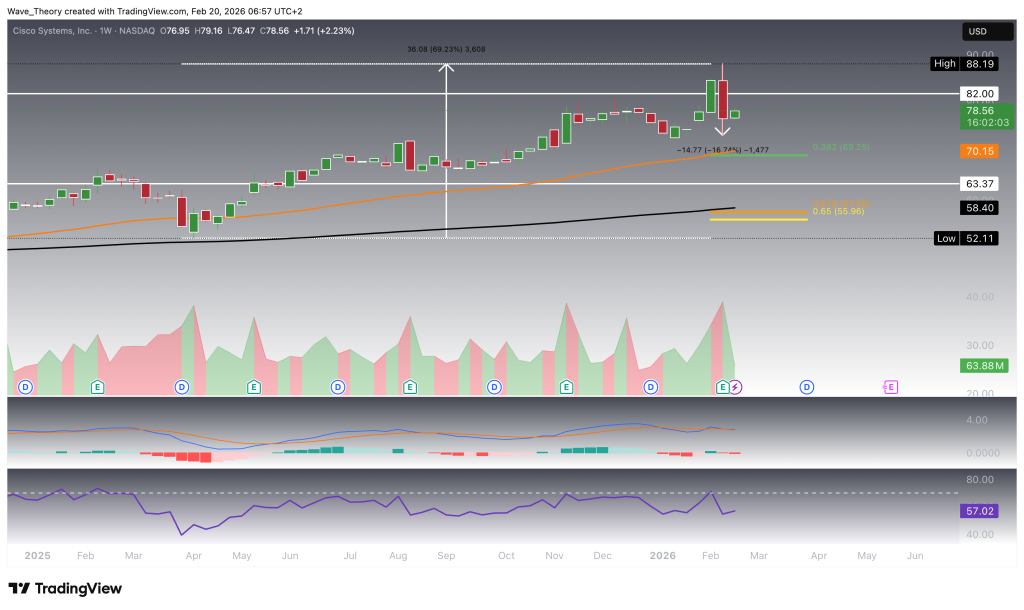
Weekly Chart — Rejection at $82–$88 Triggers Pullback Toward Key Fibonacci Support
On the weekly timeframe, Cisco Systems (CSCO) has recently faced a clear rejection from the $82–$88 resistance zone, resulting in a short-term pullback of approximately 17% over the past week. This reaction highlights the significance of this supply region and confirms it as a critical barrier for continued upside.
Following this rejection, the 0.382 Fibonacci support at approximately $69.25 has become the key level to watch for maintaining bullish continuation. Holding above this level would preserve the constructive medium-term structure and increase the probability of another attempt to break the overhead resistance. However, a loss of this support would likely trigger a deeper retracement toward the golden ratio support between $55.96 and $57.55, which represents the next major demand zone within the broader uptrend.
Momentum indicators reflect increasing short-term weakness. The MACD lines have crossed bearishly, while the MACD histogram has begun ticking lower, signaling building downside momentum on the weekly timeframe. In contrast, the RSI remains in neutral territory, providing no immediate directional bias and suggesting that the pullback is not yet extended. Importantly, the EMA structure continues to display a golden crossover, confirming that the mid-term trend remains bullish, despite the recent corrective phase.
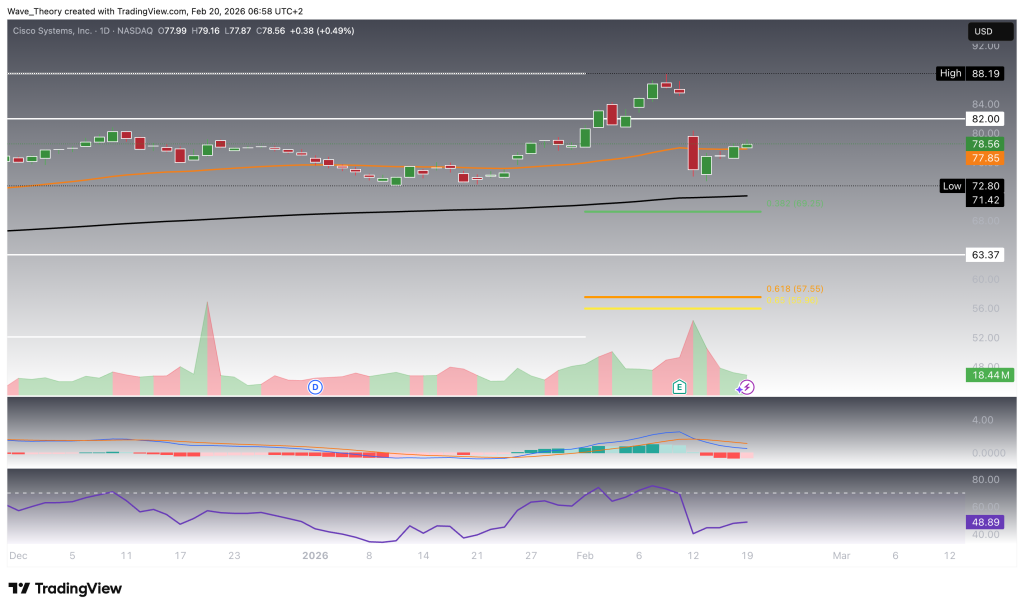
Daily Chart — Break Above 50-Day EMA Signals Short-Term Upside Potential Toward $82
On the daily timeframe, Cisco Systems (CSCO) is currently consolidating following its recent rejection near the highs, with price action hovering just below the $82 resistance level. Notably, the stock has now bullishly broken above the 50-day EMA around $78, a development that strengthens the short-term outlook and could act as a catalyst for a renewed push toward the $82 resistance zone.
From a structural perspective, immediate support lies at roughly $78, aligning with the reclaimed EMA region, while stronger support is found at the 0.382 Fibonacci level near $69.25. Holding above the $78 area is critical to maintaining near-term bullish momentum. A confirmed breakout above $82 would likely trigger a continuation move toward the previous high at $88.19. Conversely, a loss of the $77 support zone could expose the stock to a deeper retracement toward the mid-$60s, where additional demand may emerge.
From an indicator standpoint, the signals are mixed but improving. The MACD lines remain bearishly crossed, reflecting residual downside pressure from the recent pullback. However, the MACD histogram has started to tick bullishly higher, indicating that bearish momentum is fading and a potential bullish crossover may be developing. At the same time, the EMA structure continues to display a golden crossover, confirming that the short- to medium-term trend remains bullish. The RSI is positioned in neutral territory, providing no overbought constraint and leaving room for further upside in the near term.
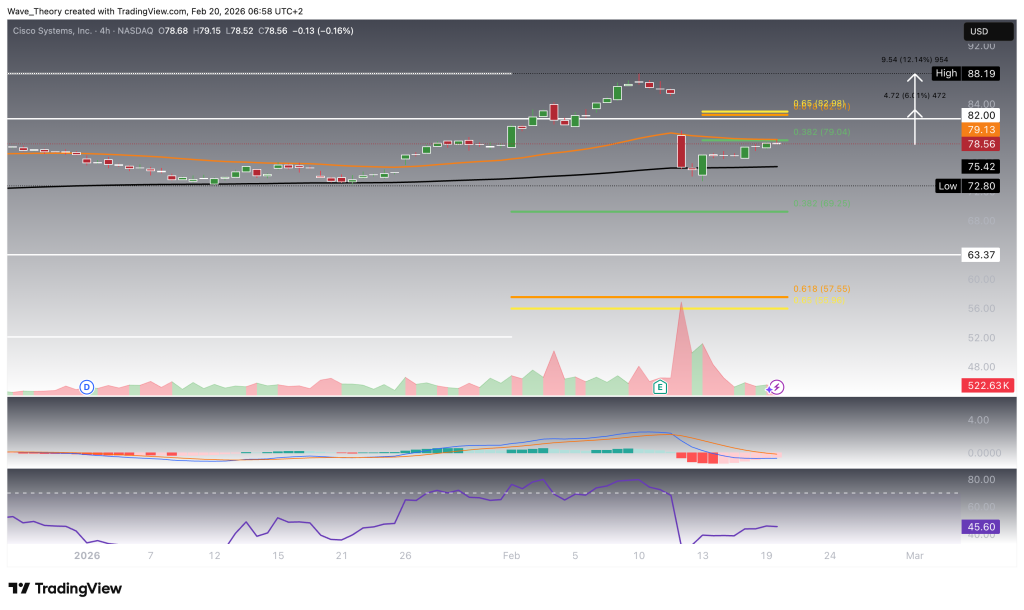
4H Chart — Short-Term Recovery Faces Key Resistance at $79
On the 4-hour timeframe, the CSCO stock is showing signs of short-term recovery following a sharp decline, but price action remains capped below a critical resistance cluster around $79. This zone is reinforced by a confluence of the 0.382 Fibonacci retracement and the 50-4H EMA, making it a key barrier for bullish continuation in the immediate term.
From a structural perspective, the 0.382 Fib at approximately $79 is acting as immediate resistance, while the 200-4H EMA near $75.4 provides short-term support. A sustained hold above this support keeps the current recovery attempt intact. However, if price is rejected at the $79 resistance zone, the stock could retrace toward $72.8, with a further downside extension toward the broader support at $63.37 if selling pressure accelerates. Conversely, a confirmed breakout above $82 would invalidate the short-term bearish structure and reopen the path toward the recent highs.
Despite the overhead resistance, momentum indicators are turning increasingly constructive. The EMA structure has formed a golden crossover, confirming a bullish trend bias on the lower timeframe. The MACD lines are on the verge of a bullish crossover, while the MACD histogram is trending strongly higher, signaling building upside momentum. Meanwhile, the RSI remains in neutral territory, indicating no immediate overbought conditions and leaving room for further upside expansion.
Should CSCO break above the $79 resistance, it would likely trigger a continuation move toward the golden ratio resistance near $83, or even a retest of the previous high around $88, implying an upside potential of approximately 6% to 12% from current levels.
CSCO Stock Outlook — Key Levels
Cisco Systems (CSCO) remains in a macro bullish trend, but is currently consolidating below the critical $82–$88 resistance zone.
Bullish Scenario:
A breakout above $82 opens the path to $88, with extension toward $95+. Short-term trigger sits at $79.
Bearish Scenario:
Rejection below resistance could lead to a pullback toward $69.25 (0.382 Fib). Loss of this level exposes $63.37, with deeper downside toward $56 (0.618 Fib).
Key Levels:
-
Resistance: $79, $82, $88
-
Support: $77, $75.4, $72.8, $69.25, $63.37, $56
Overall, trend remains bullish, but $82 is the decision level.
- Check out our free forex signals
- Follow the top economic events on FX Leaders economic calendar
- Trade better, discover more Forex Trading Strategies
- Open a FREE Trading Account
- Read our latest reviews on: Avatrade, Exness, HFM and XM