Ethereum Bounces to $1,900 But Bears Still Hold the Keys: Technical Rebound or Dead Cat?
After a brutal 14% decline over the previous 10 days that sent the currency as low as $1,748 on Wednesday, Ethereum recovered to above $1.9K
Quick overview
- Ethereum experienced a 14% decline but rebounded to over $1,900, marking a 4.5% daily gain.
- Despite the price recovery, experts warn it may be an oversold bounce rather than a genuine rebound, with negative overall price structure.
- Onchain activity and institutional interest are declining, with significant net withdrawals from Ether ETFs and reduced economic activity on the network.
- The path forward for ETH remains uncertain, with critical resistance levels at $1,922 and potential downside risks if key support levels fail.
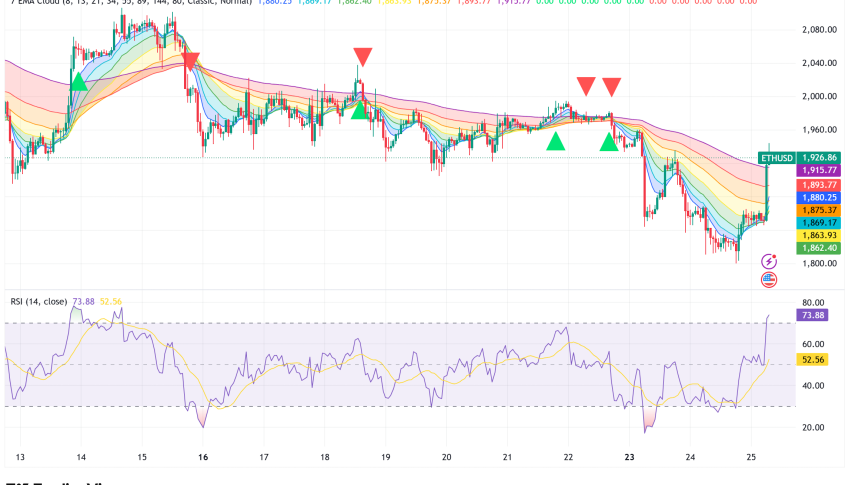
After a brutal 14% decline over the previous 10 days that sent the currency as low as $1,748 on Wednesday, Ethereum ETH/USD recovered to above $1,900, registering a 4.5% gain over the course of the day. However, experts advise caution because the rise appears to be more of an oversold bounce than the beginning of a real rebound.
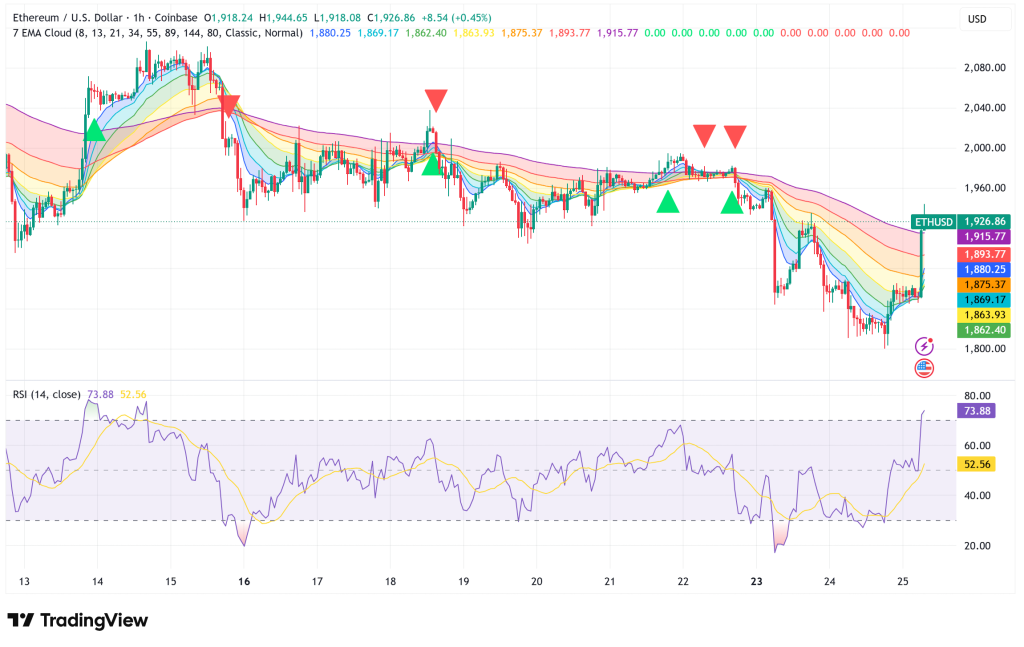
Prior to Tuesday’s rescue rebound, the 14-period RSI had fallen to 30.31, which is far into oversold territory. The overall price structure is still solidly negative, with ETH trading well below its major moving averages, despite the fact that trading volume reached $19.29 billion, indicating genuine purchasing interest. The 7-day exponential moving average, which is close to $1,922, is currently where the immediate test is located. The first clear indication that short-term momentum is changing would be a daily closure above that level. If it is not held, the likelihood of a retest of the $1,748 swing low increases.
Ethereum’s Onchain Activity and ETF Flows Paint a Grim Picture
Ethereum’s basic demand metrics are declining despite the price rebound. While 30-day network costs have fallen to $13.7 million, less than half of the $33 million average recorded in late 2025, the total value locked throughout the network has fallen to $51 billion, the lowest since May 2025. There is less economic activity on the chain as deposits into decentralized applications decline, which lowers the natural demand for ETH.
Additionally, institutional interest is waning. Since February 11, net withdrawals of $405 million have reduced the total assets under management of US-listed Ether ETFs to $12.4 billion. The timing is noteworthy: while gold prices rose above $5,150 in the week ending February 20, gold ETFs brought in $822 million, nearly exactly matching the outflow period. A technical bounce is not enough to counteract the headwind of capital shifting from cryptocurrency to more conventional safe havens.
ETH Whale Retreat and a $2 Billion Short Wall Overhead
Huge numbers of participants are silently withdrawing. In recent weeks, the average whale sell order size on Binance has decreased from about 2,250 ETH in early January to about 1,350 ETH; researchers at CryptoQuant characterize this drop as “gradual disengagement.” ETH’s ability to withstand abrupt selling pressure is less than it appears because there aren’t as many huge resting orders in the book.
The options market is also protective. On Tuesday, the 30-day options delta skew reached 18% and the put-to-call volume ratio jumped to 2.2x, indicating that puts are trading at a pronounced premium as traders rush for downside protection. With a 20-day correlation above 95% for three weeks in a row, ETH is likewise moving almost exactly in lockstep with Bitcoin, making it difficult for it to separate and rise on its own.
Futures liquidation data indicates that approximately $2 billion in short bets are grouped around the $2,000 level, which might be a bullish wildcard. If buyers maintain momentum, that region of high liquidity can function as a magnet, drawing the price upward.
Ethereum Price Prediction: Key Levels to Watch
Until ETH is able to recover important technical milestones, the path of least resistance stays downward. Prior to the more critical $2,547 (38.2% Fibonacci retracement) and $2,025 (78.6% Fibonacci retracement), the initial gate on the upside is $1,922 (7-day EMA). On the downside, the daily pivot around $1,841 needs to hold; if it doesn’t, there’s a chance that the price could drop near $1,600, where long liquidations of about $682 million might be found, and possibly even farther into the historical accumulation zone of $1,384–1,691.
The bright side is that amid February’s selloff, accumulation addresses covertly accumulated over 2.5 million ETH, increasing overall holdings to 26.7 million ETH. Although there is still demand below the surface, ETH’s recovery is on borrowed time until derivatives measures level off and onchain activity picks back up.
- Check out our free forex signals
- Follow the top economic events on FX Leaders economic calendar
- Trade better, discover more Forex Trading Strategies
- Open a FREE Trading Account
- Read our latest reviews on: Avatrade, Exness, HFM and XM
Related Articles
Sidebar rates
Related Posts