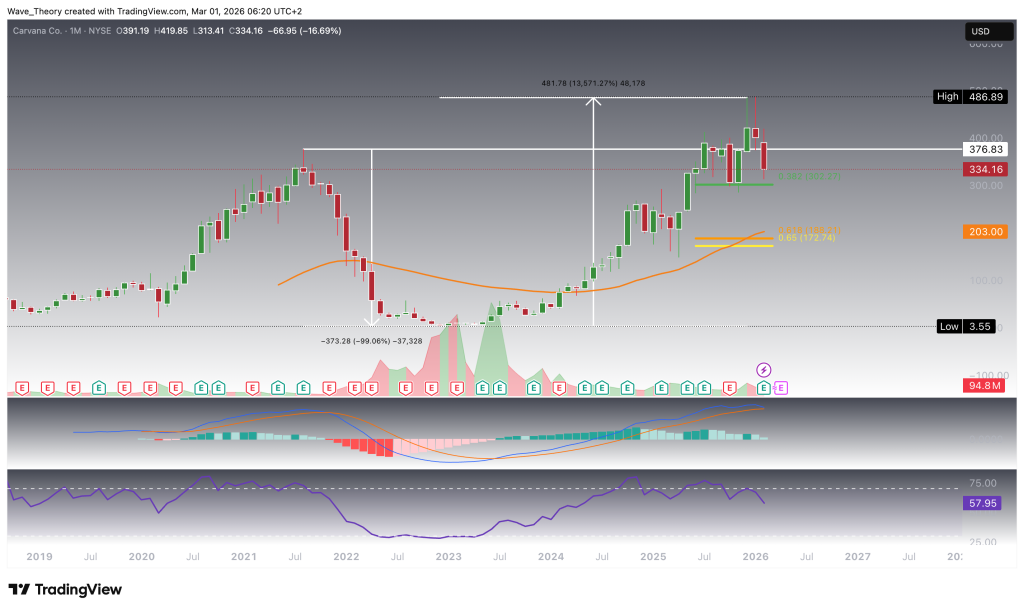
Carvana (CVNA) has experienced a remarkable recovery of over 13,571% after a significant decline during the COVID-19 pandemic, reaching a new all-time high of approximately $478.
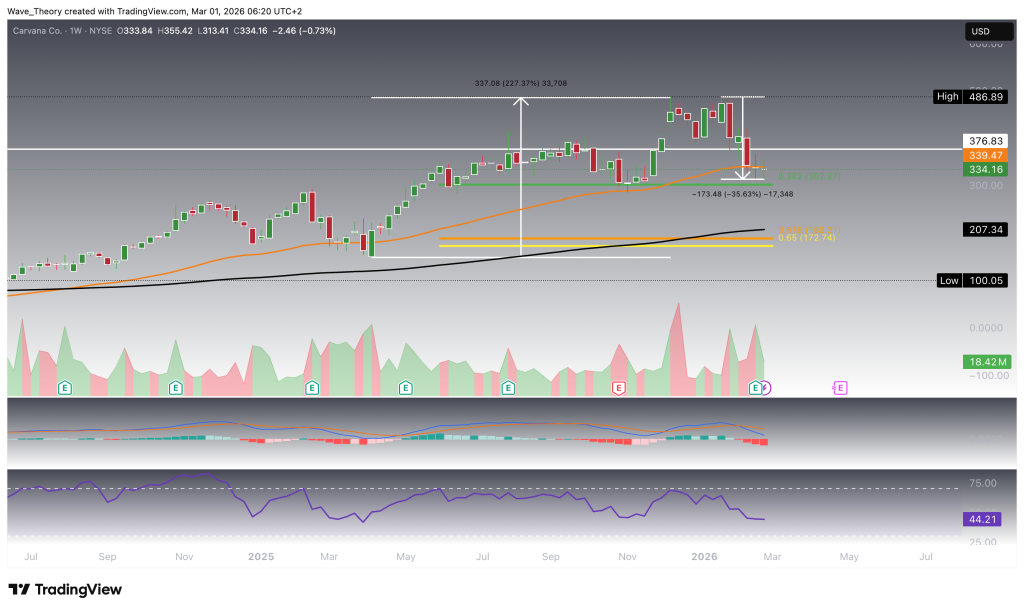
Currently, CVNA is in a corrective phase, having declined about 36% and testing critical support at the 0.382 Fibonacci level around $302.
The stock's ability to hold above $302 is crucial for maintaining its bullish potential, while a breakdown could lead to further declines toward the golden ratio support at $172.
Momentum indicators present a mixed outlook, with short-term bearish signals but signs of stabilization on lower timeframes, indicating potential for a bounce if key support holds.
Carvana (CVNA) has delivered one of the most extraordinary reversals in recent market history. Following a brutal 99% decline over roughly 18 months during the COVID-pandemic, the stock capitulated at a low of $3.55, marking a definitive cycle bottom. From that point, CVNA ignited an explosive recovery, rallying more than 13,571% over the subsequent three years — a move that firmly re-established it as one of the most volatile and momentum-driven equities in the market.
This dramatic price action reflects both extreme sentiment shifts and aggressive repricing of risk, placing CVNA at a technically pivotal stage once again. The key question now is whether this recovery can sustain its momentum — or if another major inflection point is approaching.
Carvana (CVNA) Hits New All-Time High Before Entering Corrective Phase
Carvana (CVNA) recently established a new all-time high at approximately $478 last month, capping off an extraordinary rally of over 13,571% across the preceding three years. This parabolic advance reflects a sustained bullish trend characterized by strong momentum and aggressive repricing. However, following the formation of this new peak, CVNA has entered a corrective phase, with price action declining sharply and decisively breaking below the former all-time high support at $377 — a level that previously acted as a key structural pivot.
As a result of this breakdown, the stock is now approaching a critical Fibonacci retracement level, finding significant support at the 0.382 Fib level around $302. This zone represents a key technical inflection point within the broader uptrend, where a bullish reaction could emerge. Should CVNA hold this support, the potential for a renewed upside move remains intact, with the stock likely to retest the all-time high region near $487 and potentially extend into price discovery beyond that level.
From a momentum perspective, the monthly indicators present a mixed outlook. The RSI is showing a bearish divergence, signaling weakening underlying momentum despite the recent highs, while the MACD histogram has started to decline since last month, reinforcing the onset of a corrective phase. In contrast, the MACD lines remain bullishly crossed, indicating that the broader long-term trend structure has not yet fully reversed.
Taken together, CVNA appears to be undergoing a technically healthy correction within a larger bullish framework. The reaction at the $302 support level will be critical in determining whether this pullback remains corrective in nature or evolves into a deeper structural retracement.
Carvana
Carvana (CVNA) Corrects 36% as Price Tests Key Fibonacci Support Levels
Carvana (CVNA) has already declined by approximately 36% over the past few weeks, marking a significant pullback from its recent all-time high. In the process, the stock has decisively broken below the 50-week EMA at $339.5, signaling weakening medium-term momentum and confirming the ongoing corrective phase. Price is now testing the 0.382 Fibonacci retracement level around $302, which currently acts as a key support zone and potential inflection point.
Should this level fail to hold, the next major downside target lies at the golden ratio support around $172. This level is further reinforced by the 200-week EMA, creating a strong confluence support zone where a bullish reaction could emerge. As long as CVNA remains above this golden ratio at $172, the overarching uptrend structure remains technically intact, despite the current correction.
Momentum indicators on the weekly timeframe present a mixed picture. The EMAs continue to display a golden crossover, confirming that the broader mid-term trend remains bullish. However, this is contrasted by bearish signals from the MACD, with the MACD lines bearishly crossed and the MACD histogram trending lower, reflecting sustained downside momentum. Meanwhile, the RSI remains in neutral territory, indicating the absence of both oversold conditions and clear bullish divergence.
Overall, CVNA is undergoing a corrective retracement within a still-intact bullish structure, with the reaction at key Fibonacci support levels likely to determine whether the stock resumes its uptrend or extends its correction toward deeper support.
Carvana
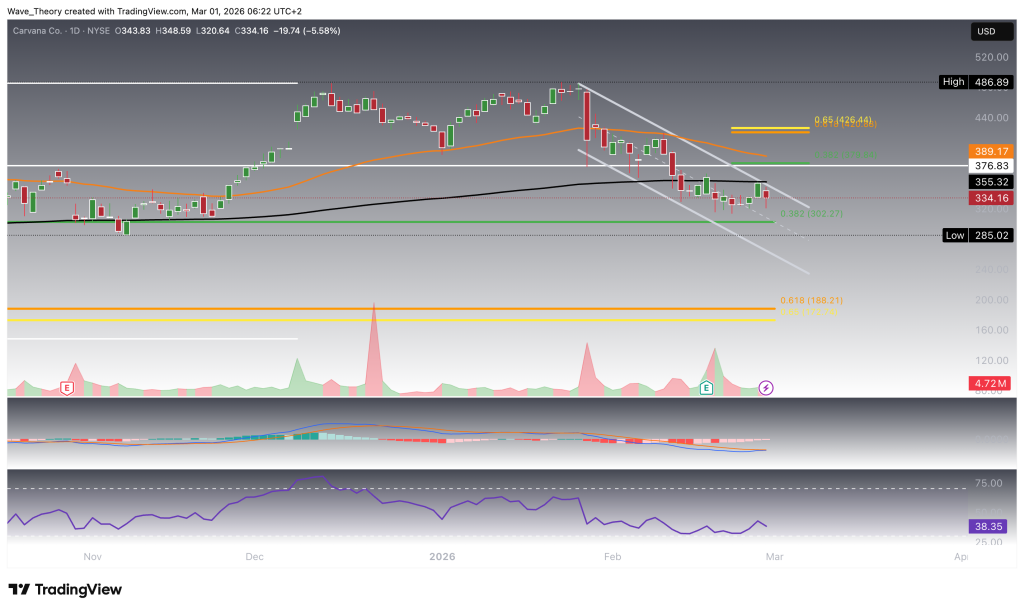
Carvana (CVNA) Trades Within Descending Channel as Momentum Shows Early Bullish Signals
On the daily timeframe, CVNA is clearly moving within a well-defined downward channel, reflecting the ongoing corrective phase following its recent all-time high. Price action continues to respect this structure, with lower highs and lower lows defining the short-term trend. Recently, the stock faced a bearish rejection at the 200-day EMA resistance around $355, reinforcing the channel’s upper boundary as a key dynamic resistance level.
In the near term, CVNA could revisit the 0.382 Fibonacci support around $302, which remains a critical downside level within the current structure. However, despite the prevailing corrective channel, momentum indicators are beginning to tilt more constructively.
The EMAs on the daily chart continue to display a golden crossover, confirming a bullish trend in the short- to medium-term context. Additionally, the MACD histogram has been ticking bullishly higher over the past few days, signaling strengthening upside momentum, while the MACD lines are on the verge of a bullish crossover — a development that could further support a potential recovery. Meanwhile, the RSI remains in neutral territory, leaving room for price expansion in either direction.
Should CVNA initiate an upward move, the next key resistance levels are defined by Fibonacci retracements at $380 and $425. The $425 level, representing the golden ratio, is particularly critical — only a decisive breakout above this threshold would invalidate the ongoing correction and signal a return to the broader bullish trend. In such a scenario, CVNA could retest its all-time high near $487 and potentially extend into new highs.
Carvana
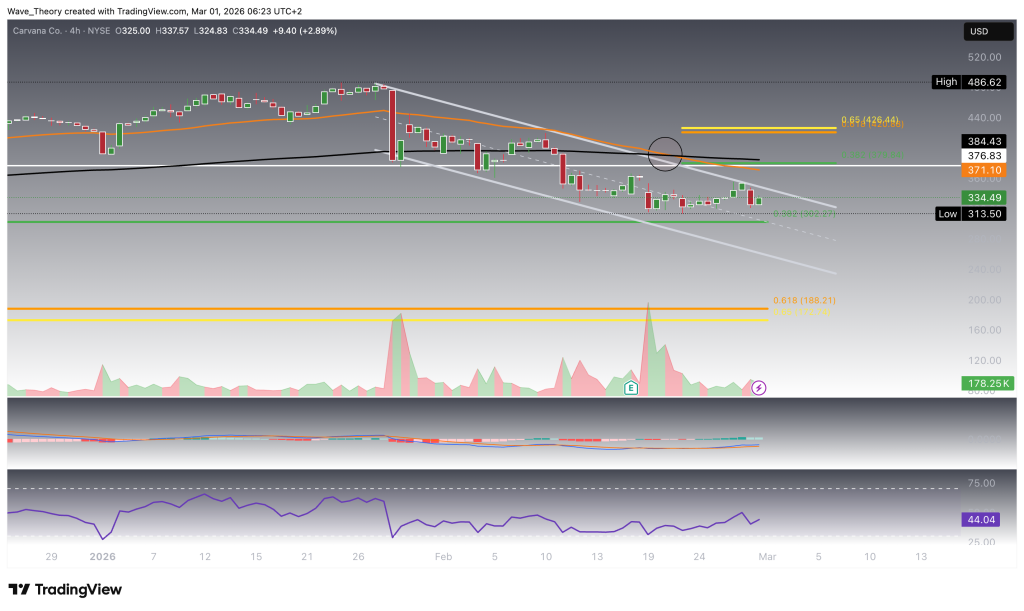
Death Cross on 4H Chart Signals Short-Term Weakness for Carvana (CVNA)
On the 4-hour chart, CVNA has formed a death cross, with the shorter-term EMAs crossing below the longer-term averages, confirming a bearish trend in the immediate term. This development reflects ongoing short-term selling pressure within the broader corrective structure.
Momentum indicators, however, present a mixed picture. The MACD histogram has started to tick bearishly lower, indicating weakening upside momentum, while the MACD lines remain bullishly crossed — a divergence that often signals consolidation or increased volatility. Meanwhile, the RSI continues to move in neutral territory, offering no clear directional bias.
From a price structure perspective, CVNA maintains near-term upside potential as long as it holds above the 0.382 Fibonacci support at $302. This level acts as a key short-term pivot and potential base for a relief bounce. However, a confirmed breakdown below this support would likely accelerate the correction, opening the door for further downside toward the golden ratio support at $172, which represents the next major higher-timeframe demand zone.
Carvana
Carvana (CVNA) at a Critical Inflection Point — Key Levels to Watch
CVNA has entered a corrective phase after reaching a new all-time high near $478–$487, already declining by roughly 36% and breaking key support levels, including the former ATH at $377 and the 50-week EMA at $339.5. The stock is now testing a critical confluence support at the 0.382 Fibonacci level around $302, while trading within a descending channel on the daily timeframe.
Despite the correction, the broader uptrend remains intact as long as CVNA holds above the golden ratio support at $172, where the 200-week EMA provides additional structural support. Momentum signals across timeframes remain mixed, with bearish pressure in the short term but emerging signs of stabilization on lower timeframes.
Holding above $302 keeps the potential for a bullish bounce and continuation toward $380 and $425. A confirmed breakout above $425 would invalidate the correction and open the path back to the all-time high at $487 and beyond. However, a breakdown below $302 could trigger an extended correction toward $172.
Konstantin Kaiser comes from a data science background and has significant experience in quantitative trading. His interest in technology took a notable turn in 2013 when he discovered Bitcoin and was instantly intrigued by the potential of this disruptive technology.