Netflix (NFLX) has rebounded over 33% from its January low after a 39% decline, indicating a potential recovery phase.
The stock is approaching significant resistance levels at $98–$99.5, with a breakout above these levels potentially leading to further upside.
While higher timeframes show a bullish trend supported by golden crossovers, lower timeframes exhibit mixed signals with bearish trends indicated by death crosses.
Key support levels to watch include $90.5 and $88.8, while resistance levels are set at $98–$99.5 and $113–$113.5.
After a prolonged seven-month correction, Netflix (NFLX) has reached a major Fibonacci support zone — a critical technical level where buyers have started to step in. The stock has already shown a bullish reaction from this area, suggesting the correction could be nearing exhaustion and positioning NFLX at a potential turning point for the next upward move.
In our last analysis, we anticipated the price surge of Netflix stock.
After a 39% Decline, Netflix (NFLX) Rebounds Strongly From January Low
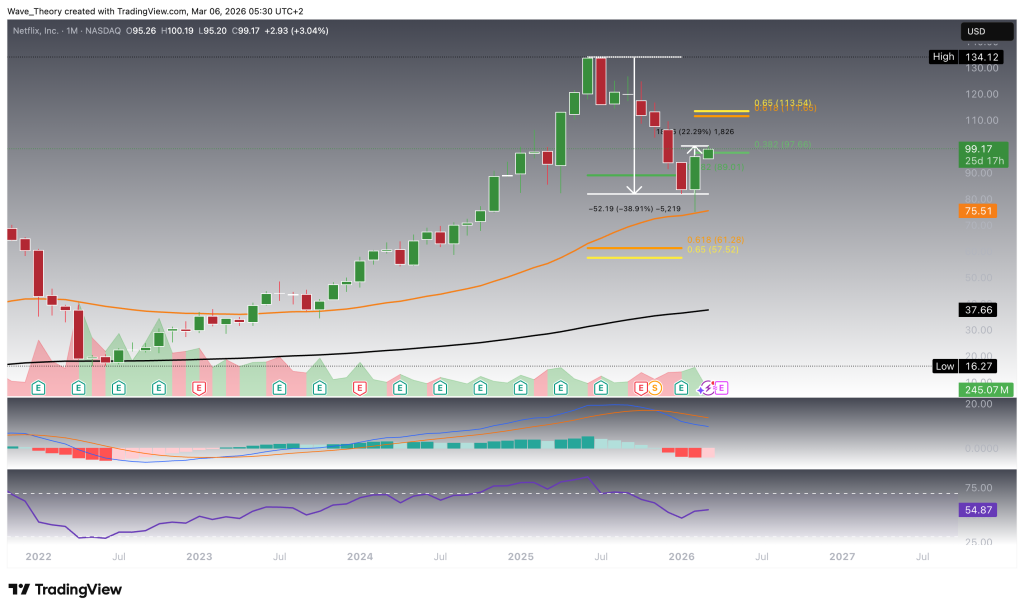
Netflix (NFLX) experienced a substantial corrective move, declining by approximately 39% before finding a bottom and initiating a strong rebound. Since its January low, the stock has surged by more than 22%, signaling a potential shift in momentum and the early stages of a recovery phase.
From a momentum perspective, the monthly indicators are beginning to improve. The MACD histogram has started to tick bullishly higher this month, suggesting that downside momentum is gradually fading. However, the MACD lines remain bearishly crossed, indicating that the broader corrective structure has not yet fully reversed. Meanwhile, the RSI continues to move within neutral territory, reflecting a balanced momentum environment without clear overbought or oversold conditions.
Trend indicators remain supportive of the longer-term outlook. The EMAs on the monthly timeframe continue to display a golden crossover, confirming that the overarching long-term trend remains bullish despite the recent correction.
Looking ahead, Netflix now faces a major resistance level at the 0.382 Fibonacci retracement near $98. A decisive breakout above this level could mark an important technical development and potentially open the door for further upside in the coming months.
Netflix
Netflix (NFLX) Surges Over 33% From Key Weekly Support
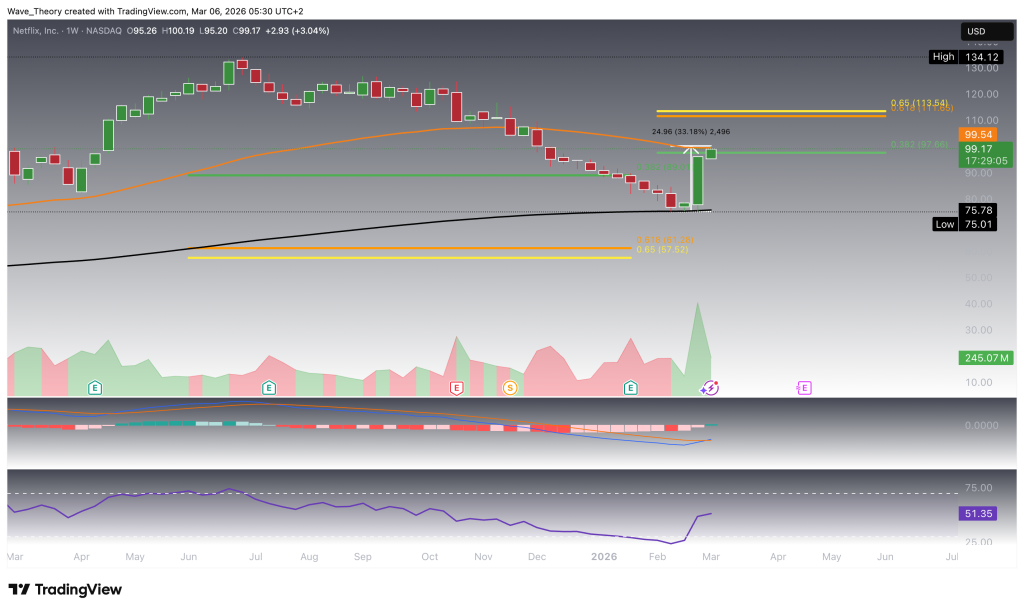
On the weekly chart, Netflix (NFLX) reached the 200-week EMA at $75, where the stock found strong support and bounced off bullishly. From this level, NFLX has surged by more than 33% over the past three weeks, signaling a powerful recovery from the recent corrective phase.
The stock is now approaching a significant resistance cluster. Not only does Netflix face the 0.382 Fibonacci resistance at $98, but it also encounters the 50-week EMA at approximately $99.5. This confluence zone represents a critical technical barrier. Should NFLX break above this resistance region, the stock could be propelled toward the next major Fibonacci resistance at the golden ratio level around $113.
A confirmed breakout above the golden ratio at $113 would effectively complete the broader correction phase, opening the path for a potential retest of the previous all-time high near $134.
Momentum indicators on the weekly timeframe support the possibility of continued upside. The MACD lines have recently crossed bullishly, while the MACD histogram has been ticking higher for the past three weeks, reflecting strengthening bullish momentum. Additionally, the EMAs continue to display a golden crossover, confirming the bullish mid-term trend structure.
Meanwhile, the RSI remains in neutral territory, providing neither bullish nor bearish signals and suggesting that there is still room for further price expansion before the market reaches overbought conditions.
Netflix
Netflix Stock: Bearish Trend Confirmation On The Daily Chart
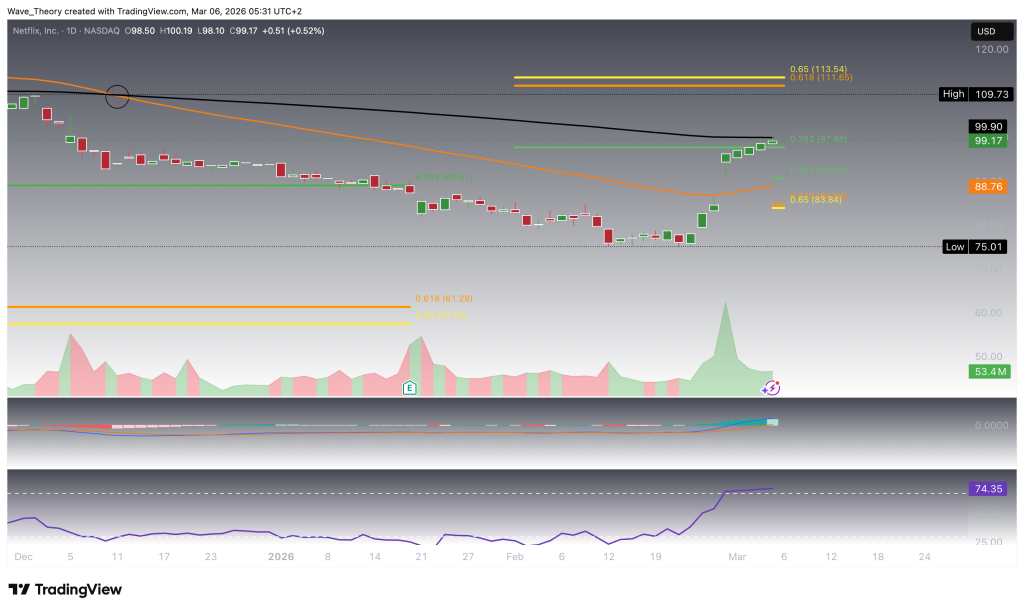
On the daily timeframe, the exponential moving averages have formed a death cross, confirming a bearish short- to medium-term trend structure. Despite this development, momentum indicators present a mixed picture. The MACD lines remain bullishly crossed, suggesting underlying recovery momentum, while the MACD histogram has recently begun ticking bearishly lower, signaling weakening upside momentum despite the prior crossover.
Meanwhile, the RSI has reached oversold territory but currently displays no clear bullish or bearish divergence, leaving the directional outlook unresolved.
From a price-action perspective, Netflix is now approaching a significant resistance zone, which could result in a bearish rejection in the near term. Should such a rejection occur, the stock would likely retrace toward its next key Fibonacci support levels at $90.5 and $84. In addition, the 50-day EMA around $88.8 serves as an intermediate dynamic support level within this range.
Netflix
Similar Outlook on the 4H Chart
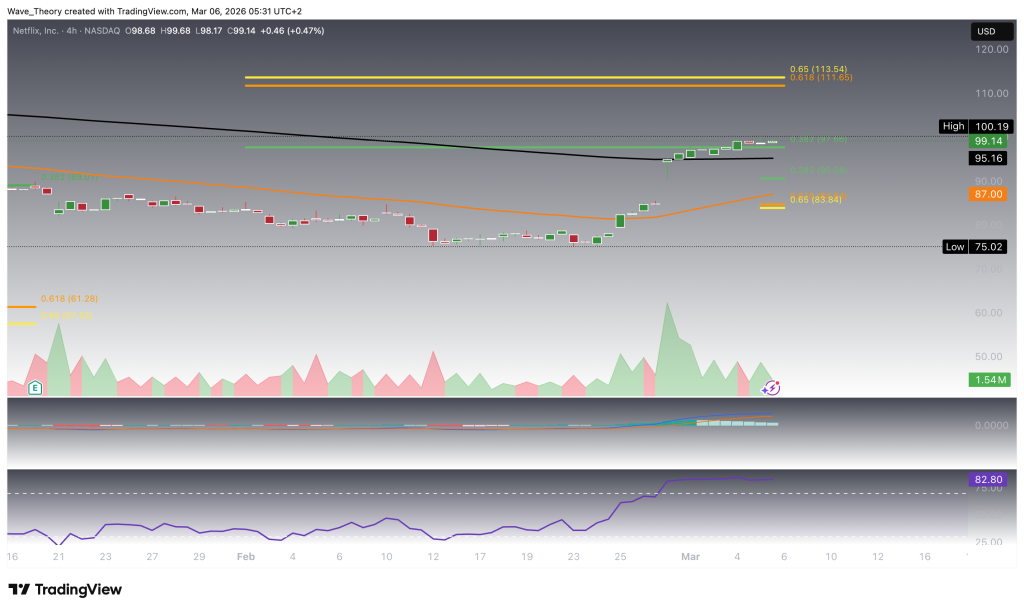
On the 4-hour timeframe, the exponential moving averages have likewise formed a death cross, confirming a bearish short-term trend structure. Momentum indicators, however, remain mixed and somewhat indecisive. The MACD lines have crossed bullishly, suggesting underlying recovery momentum, while the MACD histogram continues to print lower ticks, indicating weakening short-term momentum despite the bullish crossover. At the same time, the RSI has entered overbought territory but does not display a bearish divergence for now.
From a price-structure perspective, immediate support is located at the 0.382 Fibonacci level around $90.5. On the upside, the next significant resistance lies at the golden ratio near $113.5, which represents a key barrier that Netflix would need to break to confirm a stronger bullish continuation.
Netflix
Summary & Key Levels
After a 39% correction, Netflix has staged a strong rebound, surging more than 33% from its lows after bouncing off the 200-week EMA near $75. The broader trend structure remains bullish on higher timeframes, supported by golden crossovers on both the monthly and weekly charts, while momentum indicators increasingly show signs of recovery. However, lower timeframes still display mixed signals, including death crosses on the daily and 4H charts, suggesting short-term volatility may persist.
A breakout above the $98–$99.5 resistance cluster could propel Netflix toward the golden ratio resistance around $113. A confirmed break above $113 would likely complete the correction phase and open the path toward a retest of the previous all-time high near $134.
Konstantin Kaiser comes from a data science background and has significant experience in quantitative trading. His interest in technology took a notable turn in 2013 when he discovered Bitcoin and was instantly intrigued by the potential of this disruptive technology.