Oracle Corporation (ORCL) Stock Poised for Bullish Rebound

Quick overview
- Oracle Corporation (ORCL) is showing signs of a potential bullish reversal after a significant correction, stabilizing near key support levels.
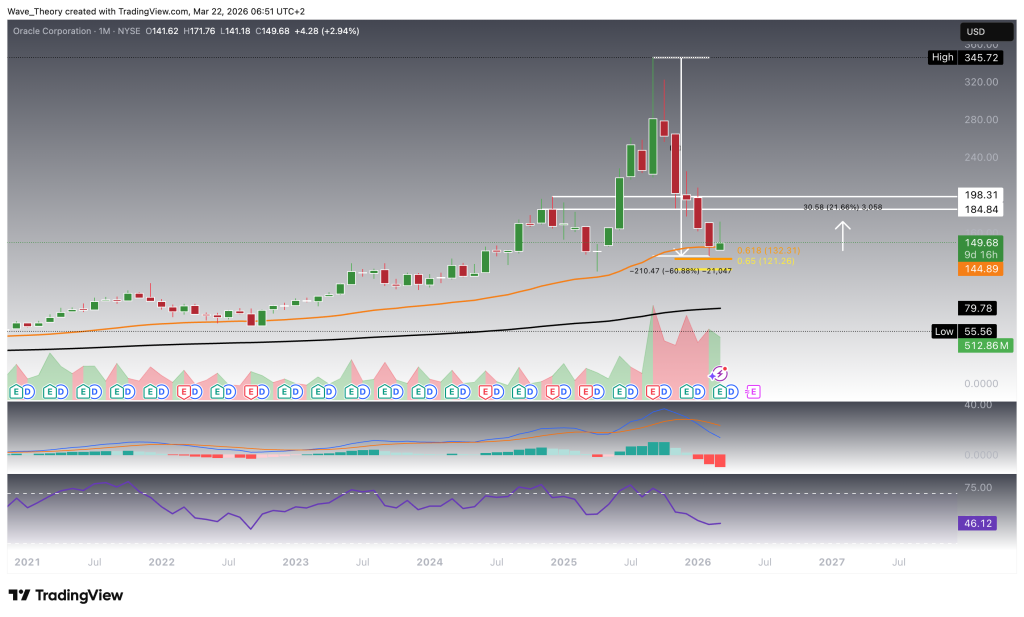
- The stock has rebounded approximately 22% from the golden ratio support at $125, with the 50-month EMA providing additional support.
- Despite mixed momentum indicators, the long-term trend remains bullish as long as Oracle holds above the critical support level.
- Key resistance levels to watch are between $185 and $198, with a breakout above $272 needed to confirm a sustained bullish expansion.
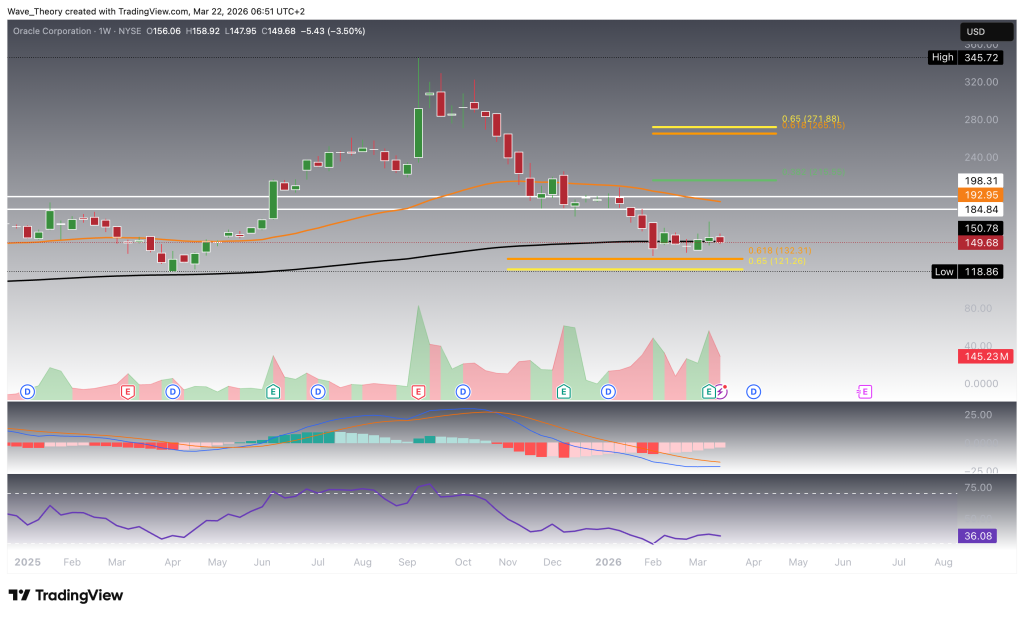
Oracle Corporation (ORCL) Weekly Structure Signals Mid-Term Bullish Bias Amid Mixed Momentum
On the weekly timeframe, the EMA structure has already confirmed a golden crossover, reinforcing a bullish mid-term trend outlook. Momentum is beginning to improve, with the MACD histogram printing a clear uptrend over the past several weeks; however, the MACD lines themselves remain bearishly crossed, signaling that confirmation is still incomplete. Meanwhile, the RSI continues to hover in neutral territory, reflecting a lack of strong directional conviction at current levels.
As long as Oracle holds above the critical golden ratio support at $125, the technical structure favors a continuation move higher, with upside targets aligned at the next key Fibonacci resistance levels of $216 and $272. A decisive breakout above the $272 golden ratio resistance would be required to fully invalidate the broader corrective phase and confirm a transition back into a sustained bullish expansion.
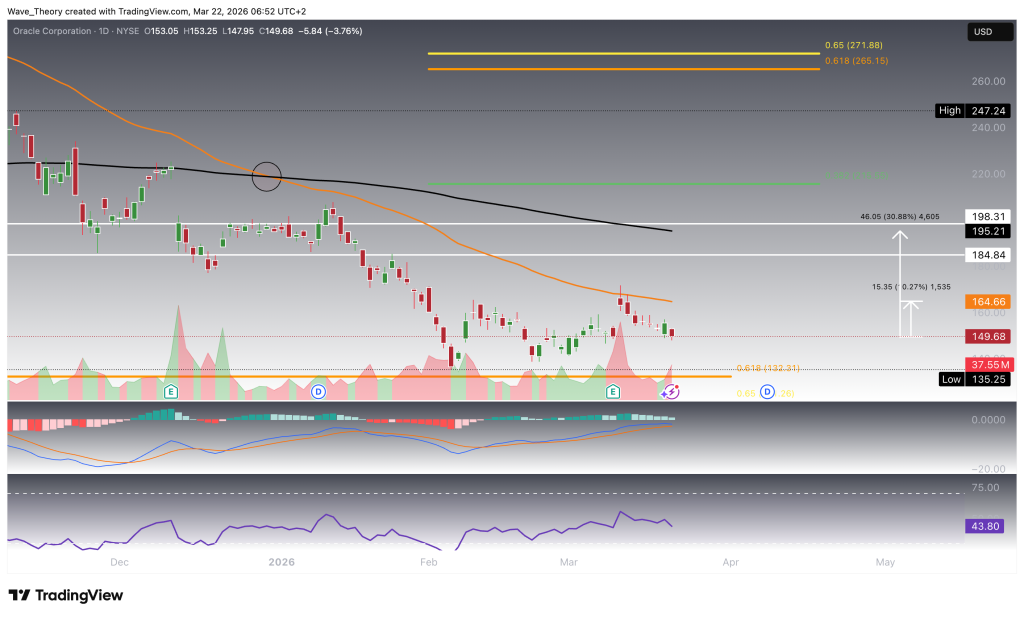
Oracle Stock (ORCL) Faces Bearish Pressure After Death Cross and Rejection at 50-Day EMA
On the daily chart, indicators are predominantly bearish, reflecting increasing short- to medium-term downside pressure. The EMA structure has confirmed a death cross, signaling a bearish trend regime, while the MACD histogram continues to decline for several consecutive sessions, indicating weakening momentum. Notably, this occurs even as the MACD lines remain bullishly crossed, highlighting a divergence that suggests fading upside strength rather than confirmed reversal.
Price action further reinforces this cautious outlook, with Oracle recently facing a clear bearish rejection at the 50-day EMA near $165. A retest of this resistance level would imply a potential upside of approximately 10% from current levels; beyond that, a move toward the next significant resistance zone between $185 and $198 would represent an extended upside potential of roughly 31%, where strong historical supply is likely to cap further advances.
Oracle Corporation (ORCL) Key Levels and Technical Summary
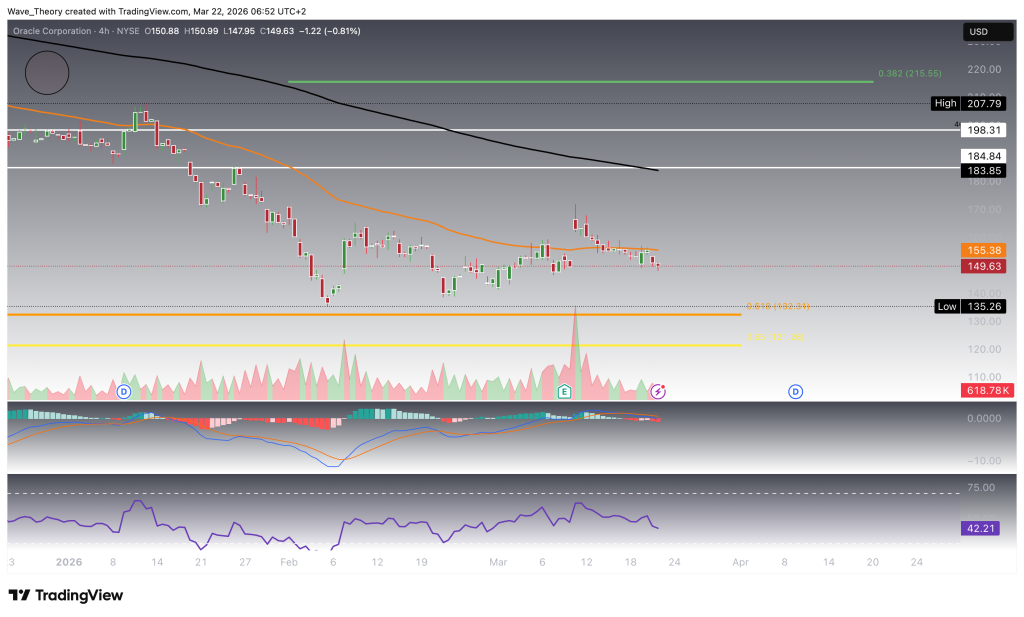
Oracle remains in a structurally bullish long-term trend, supported by a golden crossover on higher timeframes and a strong reaction from the $125 golden ratio support. However, lower timeframes (daily and 4H) continue to reflect bearish pressure, with death crosses and weakening momentum indicators signaling short-term downside risk.
Key levels to watch are $125 as critical structural support, followed by $145 (50-month EMA), while immediate resistance sits at $165 (50-day EMA). A breakout above $185–$198 would open the path toward $216 and $272, with a decisive move above $272 required to fully invalidate the broader correction and confirm a renewed bullish expansion.
As long as Oracle remains above the golden ratio support at $125, the overarching uptrend remains bullishly intact. A breakdown below this level, however, would expose significantly deeper downside potential, with the next major support resting at the 200-month EMA around $80.
- Check out our free forex signals
- Follow the top economic events on FX Leaders economic calendar
- Trade better, discover more Forex Trading Strategies
- Open a FREE Trading Account
- Read our latest reviews on: Avatrade, Exness, HFM and XM
Related Articles


Sidebar rates
Related Posts
