Microsoft Stock Hits Critical Support Zone: Is a Major Bounce Imminent?

Quick overview
- Microsoft stock has declined approximately 31.3% over the past six months but is currently at a critical support level around $380.
- A bullish rebound could lead to an initial upside target of 17.5% towards $446, with a potential breakout above $492 signaling a return to bullish momentum.
- Despite the long-term bullish outlook, short-term indicators show bearish momentum, including a death cross on the daily chart and bearish MACD signals.
- Key support levels to watch include $380, $343, and the historical demand zone between $309 and $350, while resistance levels are at $401-$418, $446-$448, and $492-$493.
Microsoft stock has endured a sharp correction over the past six months, declining approximately 31.3%. The stock has now reached a critical support zone, where a bullish rebound could be triggered, potentially driving a significant upside move.
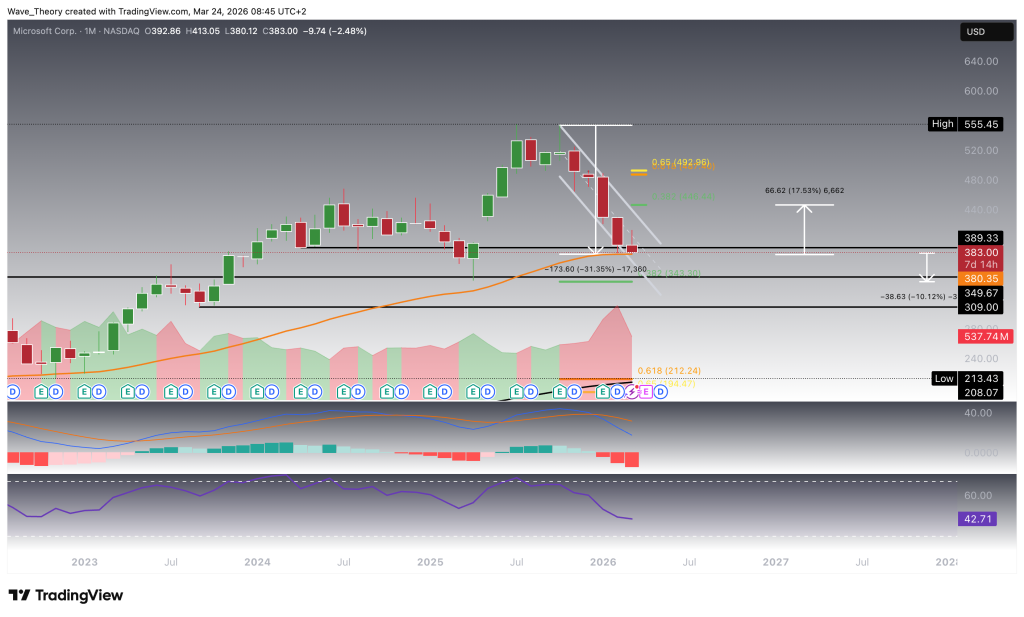
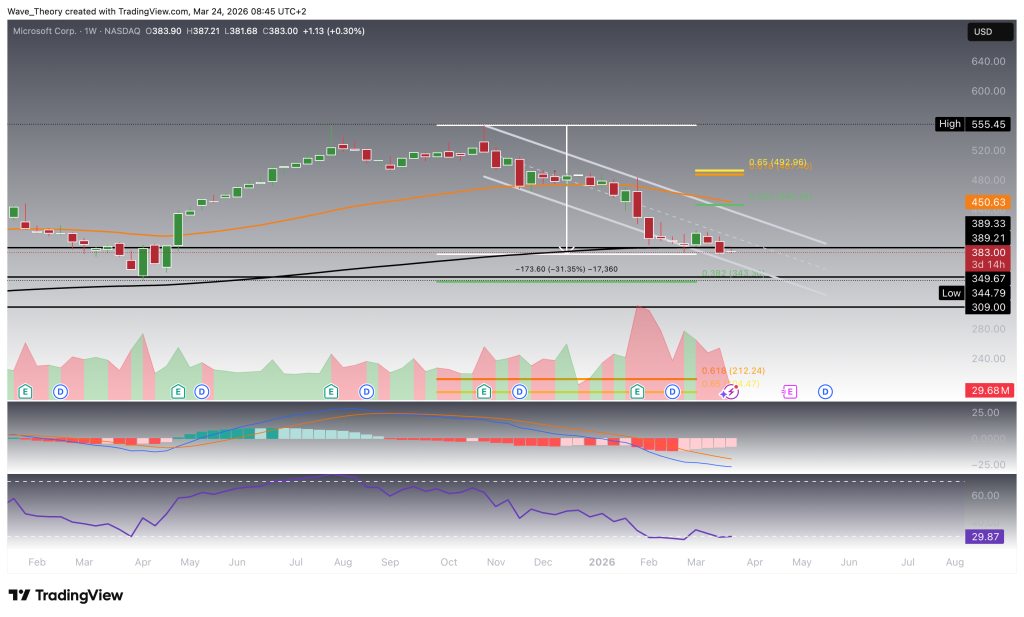
Microsoft Trending Within a Parallel Downward Channel
Microsoft stock has been trading within a well-defined parallel downward channel over the past several months, reflecting a sustained corrective phase. Despite this structurally bearish price action, early signs of a potential momentum shift are emerging. The MACD histogram has been ticking higher for five consecutive weeks, indicating building bullish momentum, while the MACD lines have already crossed to the upside. At the same time, the RSI appears to be forming a bullish divergence, suggesting waning downside pressure and increasing probability of a reversal.
Should MSFT initiate an upward move from current levels, the first key resistance lies at the 0.382 Fibonacci level around $448, where the 50-week EMA also converges, reinforcing this zone as a significant technical barrier. A confirmed breakout above this confluence would open the path toward the Golden Ratio resistance at $493. Only a decisive break above the $492–$493 region would invalidate the ongoing correction phase and shift the structure back into a clear bullish continuation, with the potential to retest the all-time high at $555.5.
Importantly, despite the six-month downtrend within the channel, the broader mid-term trend remains intact and bullish, as evidenced by the persistent golden crossover of the EMAs, underscoring that the current move is corrective rather than a full trend reversal.
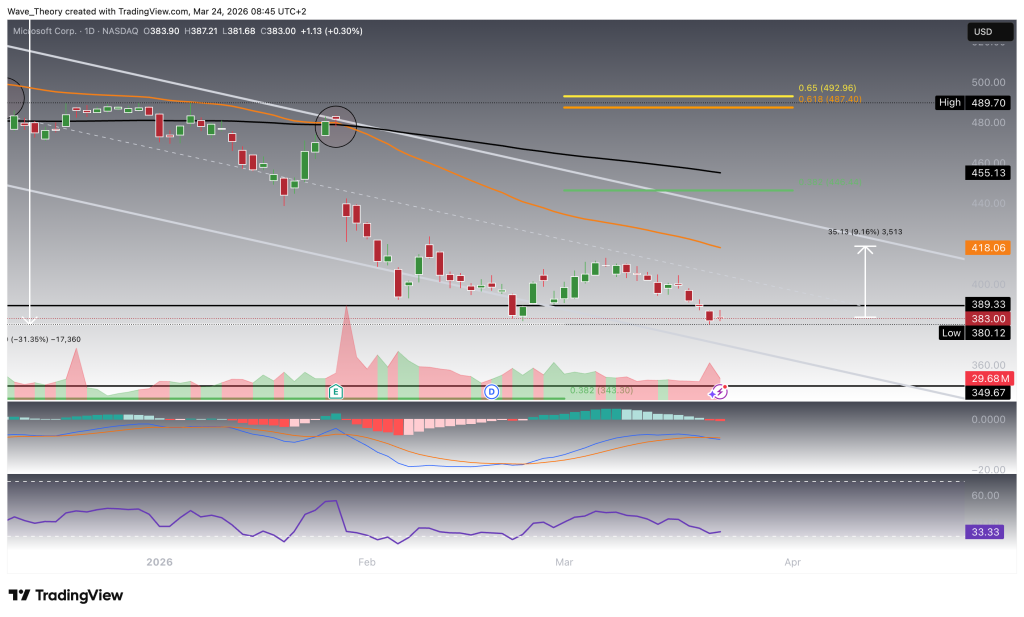
Death Cross on the Daily Chart Threatens MSFT Stock Trend
On the daily chart, Microsoft’s EMAs have formed a death cross, confirming a bearish shift in the short- to medium-term trend. This negative momentum is further reinforced by a bearish crossover in the MACD lines, while the MACD histogram has been ticking consistently lower over the past few days, signaling increasing downside pressure. Meanwhile, the RSI remains in neutral territory, hovering close to oversold levels, which reflects weakening momentum but not yet an extreme condition.
Despite this prevailing bearish setup, the stock retains the potential for a technical relief bounce. In such a scenario, MSFT could rebound by approximately 9%, targeting the 50-day EMA resistance at $418, which now acts as a key overhead barrier.
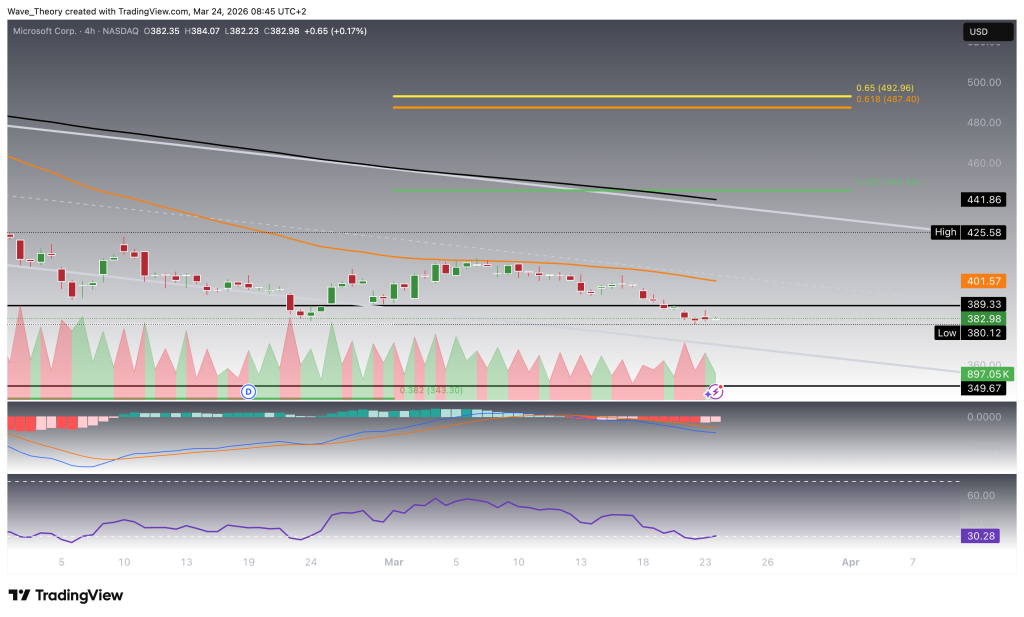
Microsoft Faces Bearish Rejection at 50-4H-EMA Resistance
Microsoft stock recently faced a clear bearish rejection at the 50-period EMA on the 4-hour chart, located at $401.6, reinforcing the prevailing short-term downtrend. This rejection underscores continued selling pressure at dynamic resistance levels. Furthermore, the bearish structure is confirmed by a death cross of the EMAs on the lower timeframe, signaling sustained downside momentum in the near term.
Momentum indicators align with this bearish outlook. The MACD lines remain bearishly crossed, indicating continued negative momentum, while the RSI is hovering near oversold territory, suggesting that selling pressure is elevated but potentially approaching exhaustion.
Notably, however, early signs of a potential shift are emerging. The MACD histogram has begun to tick bullishly higher, hinting at a possible slowdown in bearish momentum and the early stages of a short-term relief bounce, should buying pressure continue to build.
Microsoft at a Critical Inflection Point – Key Levels to Watch
Microsoft remains in a broader bullish structure but is currently undergoing a multi-month corrective phase, trading within a descending channel and below key resistance levels. While long-term trend indicators, such as the EMA golden crossover, continue to support a bullish outlook, short- to medium-term signals—including a daily death cross and bearish MACD momentum—indicate persistent downside pressure.
Key support levels:
- $380 – 50-month EMA (critical structural support)
- $343 – 0.382 Fibonacci support
- $309–$350 – Major historical demand zone
Key resistance levels:
- $401–$418 – 4H 50-EMA and daily 50-EMA resistance zone
- $446–$448 – 0.382 Fibonacci resistance + 50-week EMA confluence
- $492–$493 – Golden Ratio (trend-defining breakout level)
- $555 – All-time high target
Scenario:
- Holding above $380 keeps the bullish rebound scenario intact, with upside potential toward $446–$493.
- A confirmed break above $492–$493 would invalidate the correction and signal continuation toward $555.
- Losing $380 opens the door for a deeper retracement toward $343 and potentially the broader $309–$350 support zone.
Bottom line:
Microsoft is at a decision point—short-term bearish momentum vs. long-term bullish structure. The reaction at $380 and behavior near $448 and $492 will determine the next major move.
- Check out our free forex signals
- Follow the top economic events on FX Leaders economic calendar
- Trade better, discover more Forex Trading Strategies
- Open a FREE Trading Account
- Read our latest reviews on: Avatrade, Exness, HFM and XM
Related Articles


Sidebar rates
Related Posts
