Silver Price Analysis – March 27, 2026: XAG/USD Crashes 44% From All-Time High – Is $68 a Buying Opportunity or a Falling Knife?
XAG/USD is trading around $68.20 on March 27, 2026, down 44% from its all-time high of $121.64 in January...
Quick overview
- XAG/USD is currently trading at $68.20, down 44% from its January all-time high of $121.64, with today's US PCE inflation data expected to influence its next move.
- The sharp decline in silver prices was triggered by Kevin Warsh's nomination as Fed Chair, leading to hawkish expectations and a stronger dollar.
- Technical analysis shows XAG/USD at the apex of a descending wedge, with potential for a breakout in either direction based on upcoming economic data.
- Despite recent price drops, the long-term outlook for silver remains positive due to ongoing supply deficits and strong industrial demand.
XAG/USD is trading around $68.20 on March 27, 2026, down 44% from its all-time high of $121.64 in January. The price is now at the peak of a descending wedge, and today’s US PCE inflation data will likely determine the next move.
Why Has Silver Crashed 44% in Weeks?
Silver’s recent drop is one of the sharpest corrections seen in modern commodity markets. After moving above $100 for the first time in late January, the price fell almost 40% in less than a week.
The main trigger was Kevin Warsh’s nomination as the next Fed Chair on January 30, which led to a quick shift toward more hawkish expectations. A stronger dollar, real Treasury yields rising to 4.2%, and a Fed dot plot now showing zero rate cuts for 2026 instead of the three cuts expected earlier in the year all hurt silver, which had rallied mostly on hopes for easier policy.
China’s stricter silver export licensing is making physical supply tighter, but broader economic pressures are outweighing these fundamentals for now. The gold-silver ratio has widened to 65:1, which is historically high and in past cycles has come before strong silver rebounds.
XAG/USD Technical Analysis: A Wedge at Its Apex
Over the past six weeks, the 2-hour chart has formed a classic descending wedge. The upper trendline has been falling from the $95 highs, while the lower trendline has been rising from the $62.87 low, and both are now meeting at the current price. The breakout point is here, and a move in either direction is likely soon.
The bearish EMA crossover from the recent decline is still in place. The short-term EMA is still below the longer-term EMA, and both are trending down. Around March 21 and 22, silver tried to recover into the $74.09 resistance zone, formed spinning tops and doji candles, and then fell back. This is a classic failed breakout, now serving as a bearish retest signal.
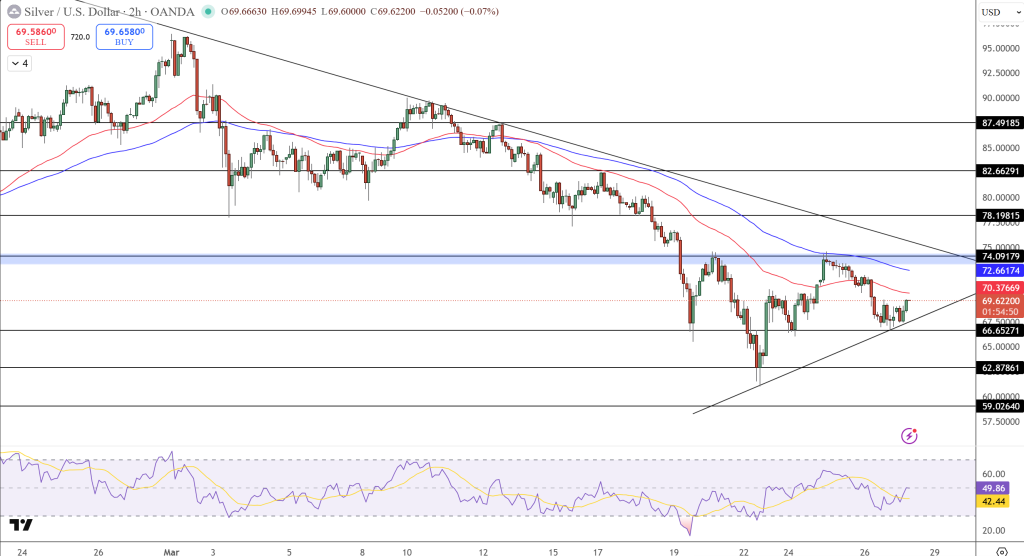
The RSI is between 42 and 49, just below the neutral 50 mark, so it does not show a clear direction. However, a hidden bullish RSI divergence has quietly formed from the $62.87 low, which could be an early sign that selling is running out of steam.
Trade setup (short bias): Sell on bearish engulfing candle rejection at $72.66–$74.09 | Stop above $75.00 | Target $66.65, then $62.87 on wedge breakdown.
PCE Today: The Catalyst That Breaks the Wedge
Today’s US PCE data is the key factor. If the reading is high, it will strengthen the dollar, end hopes for rate cuts, and likely push silver below $70, opening the way to $66.65 or lower. If the data is softer, it could trigger a relief rally toward $75 and test the wedge resistance.
There is no middle ground here. The PCE data will force a decision that the wedge pattern has been postponing.
Silver’s Long-Term Case Remains Compelling
Even after this sharp correction, the long-term case for silver remains strong. The market is heading for its sixth straight year of a supply deficit, with a projected shortfall of 67 million ounces in 2026. Industrial demand from solar, EVs, and AI data centers now makes up 59% of total silver use, and these buyers are not sensitive to price changes.
JP Morgan forecasts a 2026 average of $81/oz. Bank of America targets $135. Citigroup maintains a bullish H2 target of $110, contingent on the Fed eventually pivoting. The question, as always with silver, is not whether it recovers — it is how much pain comes before it does.
FAQ: Silver Price Crash — What Traders Need to Know
Why is silver falling so sharply in 2026? Zero Fed rate cuts are now priced for 2026, real Treasury yields have jumped to 4.2%, and the dollar is near multi-month highs — all direct headwinds for non-yielding silver. The removal of the Iran war safe-haven premium and institutional margin-call selling have compounded the move.
What is the key support level for XAG/USD right now? $70 is the psychological line the market has tested three times. Below that, $66.65 is the next technical target, with the structural capitulation wick at $62.87 below.
Is silver a buy at $68? The long-term structural case — sixth consecutive supply deficit, 59% industrial demand share, stretched 65:1 gold-silver ratio — supports a recovery eventually. Near-term, the bearish technical setup and PCE risk make $68 a falling knife until the wedge breaks bullishly or RSI divergence confirms a floor.
- Check out our free forex signals
- Follow the top economic events on FX Leaders economic calendar
- Trade better, discover more Forex Trading Strategies
- Open a FREE Trading Account
- Read our latest reviews on: Avatrade, Exness, HFM and XM
Related Articles

Sidebar rates
Related Posts
