Long USD/JPY on This Bullish Chart Setup
USD/JPY was retracing lower in the last few hours. But it is forming a reversal pattern now so we decided to make use of it and go...
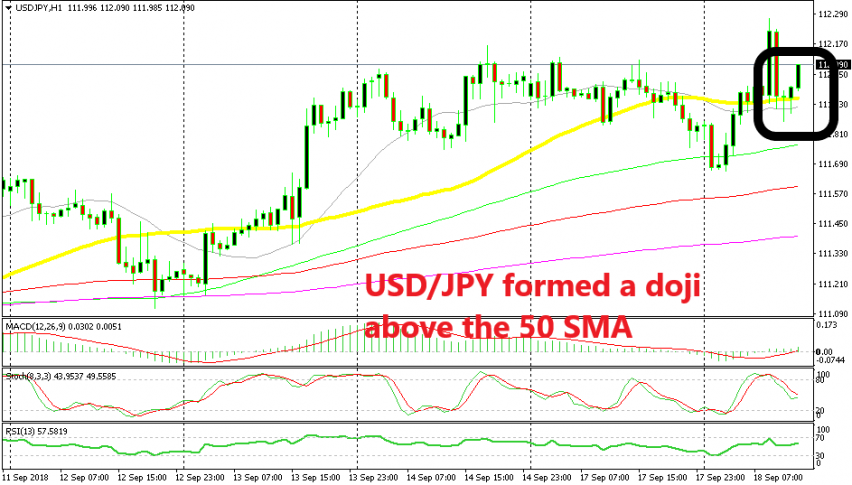
As I mentioned in my previous forex update, USD/JPY was retracing lower in the first hours of the Asian session. But it reversed at the 100 SMA (green) on the H1 chart and it climbed around 80 pips as the Asian session got underway.
When the European session started, there was a quick change in the market sentiment which sent risk currencies lower and safe havens higher. As a result, USD/JPY took a quick 40 pip dive and reached the 50 SMA (yellow).
That moving average was pierced a few times during that dive, but eventually it resisted. No candlestick closed below it, as you can see, so the break doesn’t count. The price formed a doji right above it, which is a reversing signal.
That signal from the doji candlestick gets stronger when it forms close to a moving average, as I explained in the forex article yesterday “Three best trading strategies combined”. The next candlestick formed a hammer which is another reversing signal. So, we decided to go long right there and we are already in profit now as USD/JPY makes the bullish reversal. We have to give it time now so that this trade unfolds its potential.
- Check out our free forex signals
- Follow the top economic events on FX Leaders economic calendar
- Trade better, discover more Forex Trading Strategies
- Open a FREE Trading Account
- Read our latest reviews on: Avatrade, Exness, HFM and XM
Related Articles


Sidebar rates
Related Posts
