Ethereum Surges Past $4,500 as Technical Patterns Signal Potential 100% Rally
Ethereum (ETH) is now worth more than $4,500, and it has gone up more than 3% in the last 24 hours. This is because technical indications
Quick overview
- Ethereum's price has surpassed $4,500, marking a 3% increase in the last 24 hours, with analysts predicting potential highs above $10,000.
- ETHZilla CEO McAndrew Rudisill forecasts Ethereum could reach $20,000 in three years, driven by stablecoin growth and increased adoption.
- Technical analysis reveals a Power of 3 pattern suggesting a possible 80-100% breakout by Q4 2025, with key resistance levels identified.
- Despite recent gains, concerns arise from the stagnant ETH/BTC ratio and bearish divergences in spot flow data, indicating potential pullbacks.
Ethereum ETH/USD is now worth more than $4,500, and it has gone up more than 3% in the last 24 hours. This is because technical indications and fundamental factors are coming together to suggest a possible big rise higher. The second-largest cryptocurrency by market capitalization seems to have found a solid bottom at $3,900. Analysts have set high price forecasts that could see ETH more than double from where it is now.
ETHZilla CEO Predicts $20,000 Target on Stablecoin Growth
McAndrew Rudisill, the CEO of ETHZilla Corporation, which is the eighth-largest public Ethereum treasury firm, has made a daring prediction that ETH might reach $20,000 in the next three years. He is sure of himself since Ethereum is the most popular stablecoin on the market, which is growing quickly, and it is also the way for people to send money throughout the world in US dollars.
Rudisill said, “Once it breaks through $5,000, I think it’s going to be because the base load on the infrastructure is so tight that it’s going to push each level up.” He said that Ethereum has been stable for years and is ready to break out thanks to the rise of stablecoins, especially after the GENIUS Act was signed, which intends to make the rules for stablecoins clearer.
Since changing from a biotechnology company to ETHZilla, the company has gained more than 102,000 ETH tokens. The company wants to use its holdings across layer-2 protocols to make payouts that are far greater than those from traditional staking. At the same time, this will assist establish the L2 ecosystem that will allow Ethereum to grow.
Stablecoin Dominance Provides Fundamental Support
Ethereum’s infrastructure edge in the stablecoin market gives strong fundamental backing for bullish price forecasts. Ethereum’s network processes $160 billion in stablecoin transactions right now. That’s more than twice as much as Tron, the second-largest network, which processes $76 billion. This dominance makes Ethereum the main platform for settling digital currency transactions around the world.
Rudisill thinks that the merging of traditional finance with digital assets will speed up the use of Ethereum. He says, “A lot of the new networks that have been created on layer 2s are actually going to be networks that interface with what we would call traditional finance activities in the world today, whether it be structured credit, all kinds of Wall Street applications.”
Power of 3 Pattern Emerges as Key Technical Signal
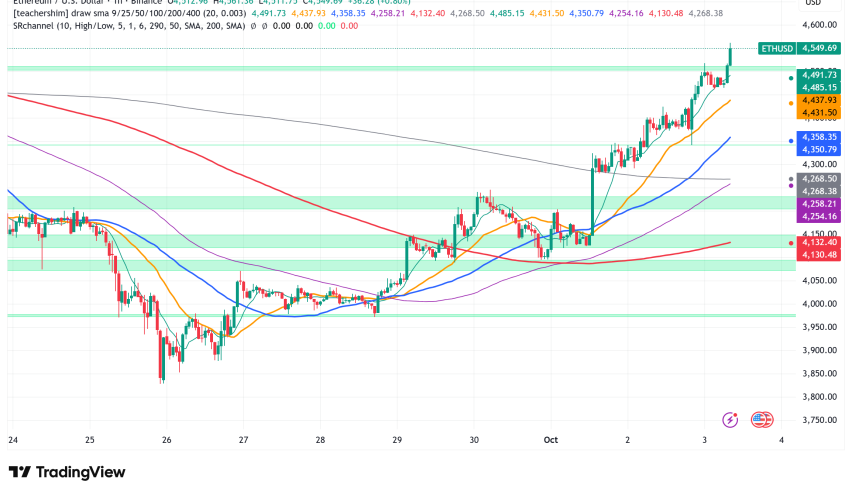
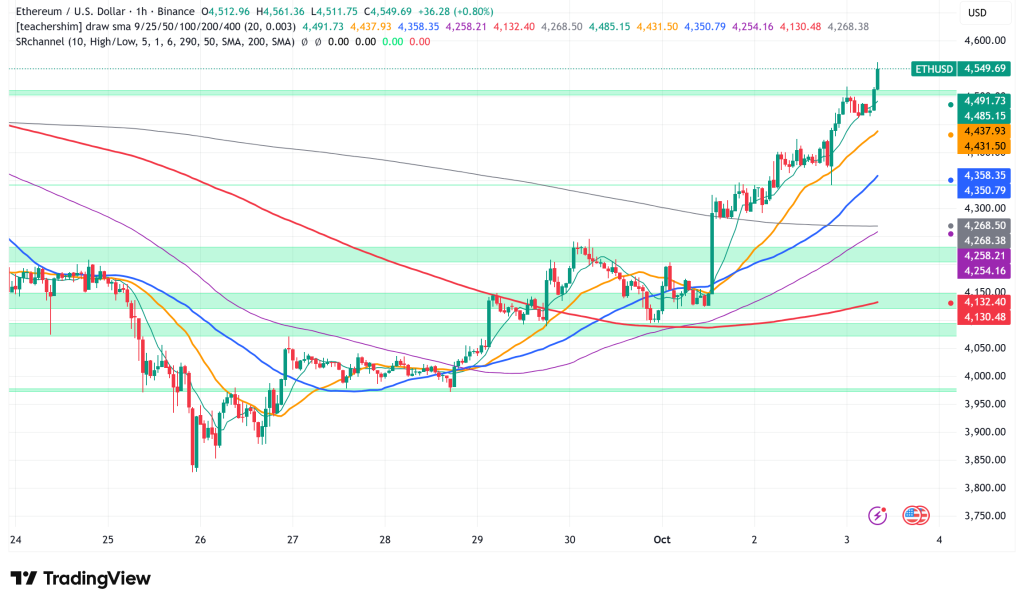
Technical analysts have found a rare Power of 3 (PO3) pattern on Ethereum’s daily chart. This means that an 80–100% breakout could happen in the fourth quarter of 2025. This accumulation-manipulation-distribution combination pushed ETH up from $2,000 to $4,900 between May and June. The present structure looks a lot like that one.
The most recent formation demonstrates that accumulation happened between $4,800 and $4,200, followed by a planned liquidity sweep below $4,000 that cleared stop losses around the $4,180 level. This movement, which happened at the same time as a daily fair value gap, is now being seen as a strategic shakeout instead of a negative reversal. This supports the optimistic story among momentum traders.
The 25-day and 50-day simple moving averages are important levels of resistance. The next important level is a daily close above $4,500. If Ethereum can hold this level, it will have a strong base from which to move toward new yearly highs. The $3,900 low is being more and more seen as a verified floor price.
Derivatives Data Shows Room for Leverage-Driven Rally
A look at Ethereum’s derivatives market shows that the recent 15% price rise happened with very small increases in open interest and futures cumulative volume delta. This means that the rise isn’t yet driven by leverage, which lowers the possibility of forced long liquidations and shows that there is a lot of space for growth if spot demand stays high.
However, a big reduction in spot CVD during the price climb shows that people are selling into strength, which is a typical bearish divergence that should make you cautious. Analysts are keeping a close eye on the $4,100-$4,250 range, where there is a lot of internal liquidity and volume inefficiencies that are still visible from the last time prices moved quickly.
ETH/BTC Ratio Stagnation Raises Short-Term Concerns
The ETH/BTC ratio has been stuck for 40 days, even though Ethereum has done well in terms of dollars. This is after a huge 150% rise from its lows. This break has caused the cryptocurrency market as a whole to become weaker because the main motor behind the recent altcoin season has stopped working.
Daan Crypto Trades, a technical analyst, said that the ETH/BTC pair was in “no man’s land.” He said that he would only be interested in it again if it went over the 0.041 level or if it decisively retested 0.032. Some analysts, on the other hand, see the current consolidation as a good correction that lets Bitcoin soak up liquidity and raise the whole market.
Ethereum Price Prediction: Bulls Target Multi-Year Highs
Ethereum is staying well above $4,500, and a number of technical signals point to a lot of upward potential. This makes the route forward look good for bulls. A strong case for a big increase may be made based on the growth of stablecoin infrastructure, the consolidation of corporate treasuries, and technical breakout patterns.
In the short run, the goal is to go back to the $4,900 level from earlier this year. In the medium term, the goal is to reach between $10,000 and Rudisill’s optimistic $20,000 forecast. However, traders should keep an eye out for any pullbacks into the $4,100-$4,250 support zone if momentum doesn’t stay above present levels, especially as spot flow data shows a bearish divergence.
- Check out our free forex signals
- Follow the top economic events on FX Leaders economic calendar
- Trade better, discover more Forex Trading Strategies
- Open a FREE Trading Account
- Read our latest reviews on: Avatrade, Exness, HFM and XM
Related Articles

Sidebar rates
Related Posts
