XRP Price Drops 7% as $2.50 Support Snaps — Are Bulls Losing Control?
XRP (XRP/USD) continues to trade with a bearish bias around $2.21, after a decisive break below the ascending trendline...
Quick overview
- XRP is trading bearishly around $2.21 after breaking below key support levels, shifting market control to sellers.
- The formation of a descending triangle suggests a continuation of the bearish trend, with a recent EMA crossover confirming bearish momentum.
- Immediate support is at $2.09, with critical levels at $1.90 and $1.72 if these fail, while a reclaim of $2.30 could signal a short-term rebound.
- Short-term traders are looking to enter short positions around $2.30–$2.35, while swing traders await a bullish signal near $2.00.
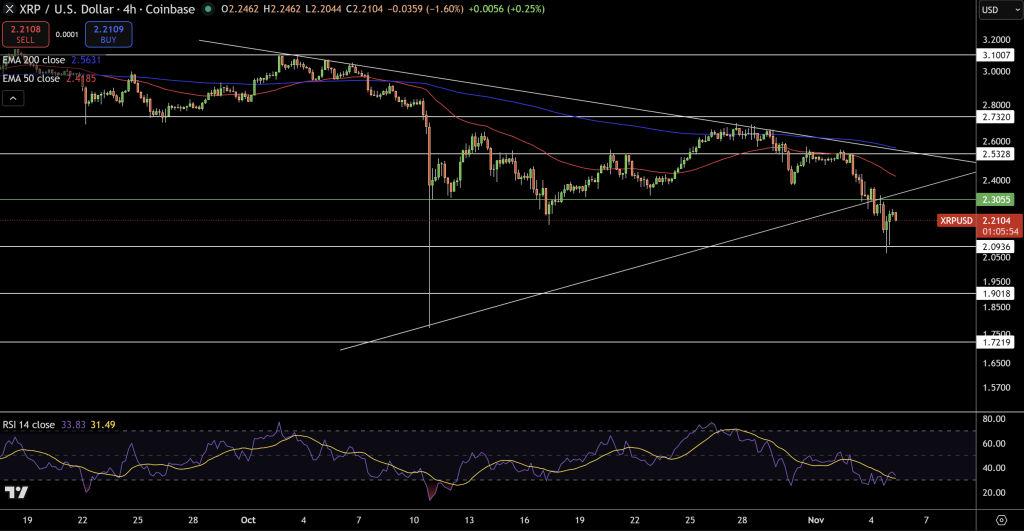
XRP (XRP/USD) continues to trade with a bearish bias around $2.21, after a decisive break below the ascending trendline and 200-EMA resistance at $2.56. The move has rattled short-term bullish sentiment and shifted market control back to sellers after weeks of sideways consolidation.
The breakdown marks a potential turning point, with XRP’s recent price action forming a descending triangle. It’s a pattern often signaling continuation of a bearish trend.
EMA Crossover Confirms Bearish Momentum
On the 4-hour chart, the technical landscape has turned increasingly defensive. The 50-EMA has crossed below the 200-EMA, often seen as a bearish signal in trend-based analysis. This crossover, coupled with a three black crows candlestick sequence, highlights persistent selling pressure.
The Relative Strength Index (RSI) at 33 suggests the market is approaching oversold territory. However, the absence of a clear bullish divergence shows momentum remains firmly with sellers — at least for now.
Key Levels to Watch
XRP is currently hovering above immediate support at $2.09, followed by the next critical base near $1.90, where buyers previously stepped in during late September.
If these levels fail, traders are eyeing $1.72 as the next major floor.
Conversely, reclaiming $2.30 could trigger a short-term rebound.
Key resistance zones:
- $2.30 (short-term pivot)
- $2.56 (50-EMA and trendline barrier)
- $2.73 (upper descending channel line)
Trade Setup: Bears Hold the Edge
Short-term traders are watching for a retest of $2.30–$2.35 to enter short positions with stops above $2.55, targeting $2.05 and $1.90.
Swing traders may wait for a bullish engulfing candle or RSI reversal near $2.00 to confirm a recovery signal.
For now, the charts favor the bears — unless XRP can convincingly reclaim the $2.50 zone with renewed volume and strength.
- Check out our free forex signals
- Follow the top economic events on FX Leaders economic calendar
- Trade better, discover more Forex Trading Strategies
- Open a FREE Trading Account
- Read our latest reviews on: Avatrade, Exness, HFM and XM
Related Articles


Sidebar rates
Related Posts
