eBay Stock Plunges 22%: Is a Strong Recovery on the Horizon?

Quick overview
- eBay's stock dropped nearly 22% last month but has rebounded to $84.40 this month.
- The stock is facing resistance at the 50-day EMA near $89, with potential support at $80.60.
- Technical indicators show a mixed outlook, with a bullish medium-term trend but caution in the short term.
- Long-term trends remain positive as key support levels hold, suggesting a potential for recovery.
Last month, eBay’s stock tumbled nearly 22%, approaching key Fibonacci support levels. This month, however, the stock has shown signs of a rebound. Can eBay recover and retest its all-time highs?
eBay Stock Shows Rebound After Sharp Decline
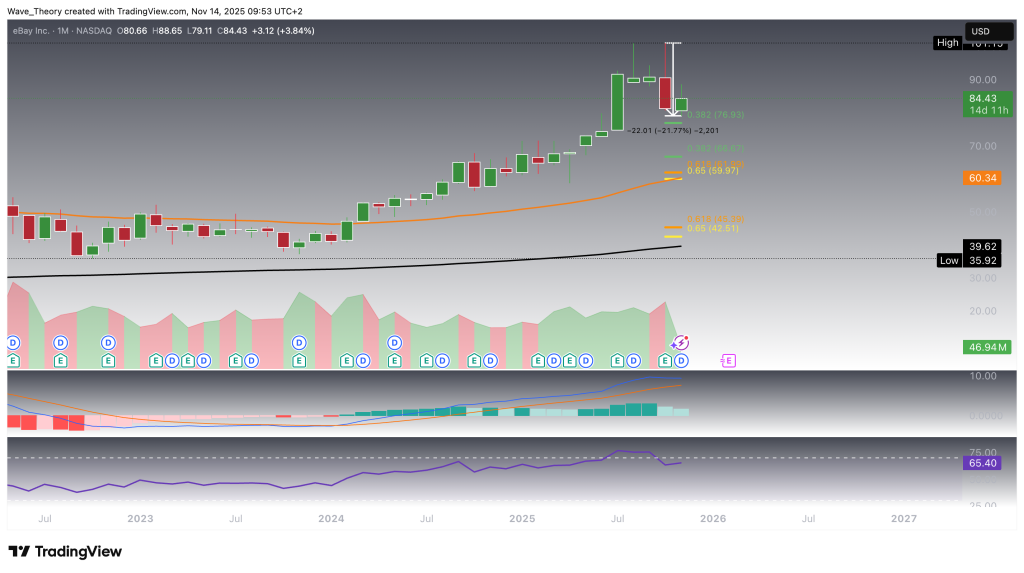
Last month, eBay’s stock plummeted nearly 22%, testing the key Fibonacci support level near $77. Despite this steep drop, the stock has staged a rapid recovery this month and is currently trading at $84.40. On the technical front, the MACD lines have formed a bullish crossover, signaling positive momentum, although the MACD histogram showed a brief bearish tick last month. Meanwhile, the RSI remains in neutral territory, indicating room for further directional movement.
If eBay’s current correction continues, the stock could potentially revisit the next significant golden ratio support near $60, where the 50-month EMA offers additional backing. Beyond that, eBay maintains major support between the 200-month EMA at $39.60 and the golden ratio level around $45. Holding above these zones would preserve the integrity of the broader bullish trend.
Long-term trend analysis remains constructive: the EMAs on the monthly chart still display a golden crossover, reinforcing the overall bullish structure and confirming that the long-term uptrend remains intact.
eBay Stock Gains 12% After Holding Key Support
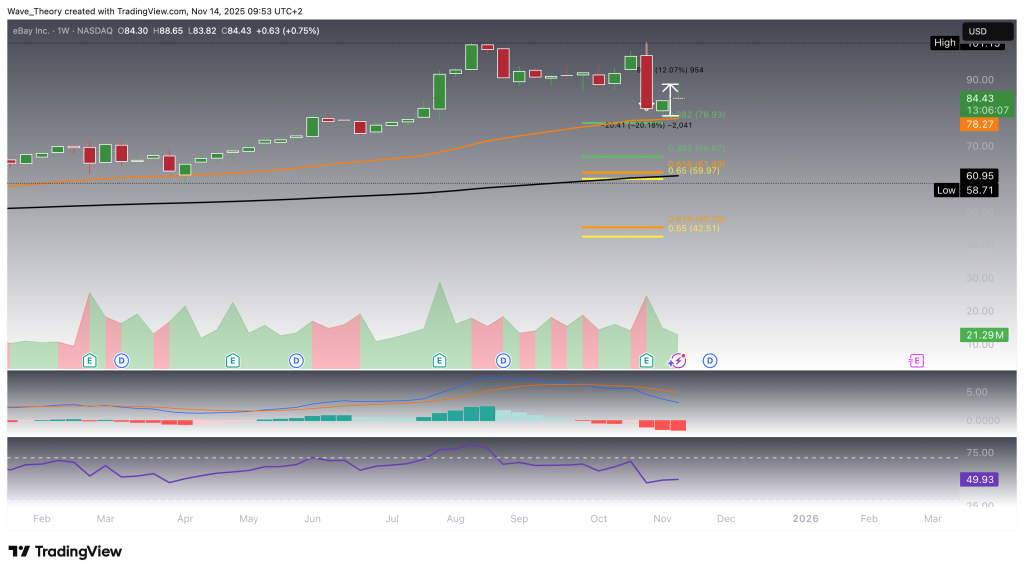
This week, eBay’s stock has rebounded roughly 12% after finding support above the 50-week EMA and the 0.382 Fibonacci retracement zone between $77 and $78.30. Despite this bounce, the MACD lines have crossed bearishly, and the MACD histogram has been trending lower for the past three weeks, while the RSI remains in neutral territory, suggesting indecision in momentum.
On the medium-term outlook, the EMAs continue to display a golden crossover, reinforcing a bullish structure. However, if the support zone between $77 and $78.30 fails to hold, eBay could potentially decline toward the next significant golden ratio support at $60, where the 200-week EMA provides additional backing.
eBay Stock Faces Rejection at 50-Day EMA Resistance
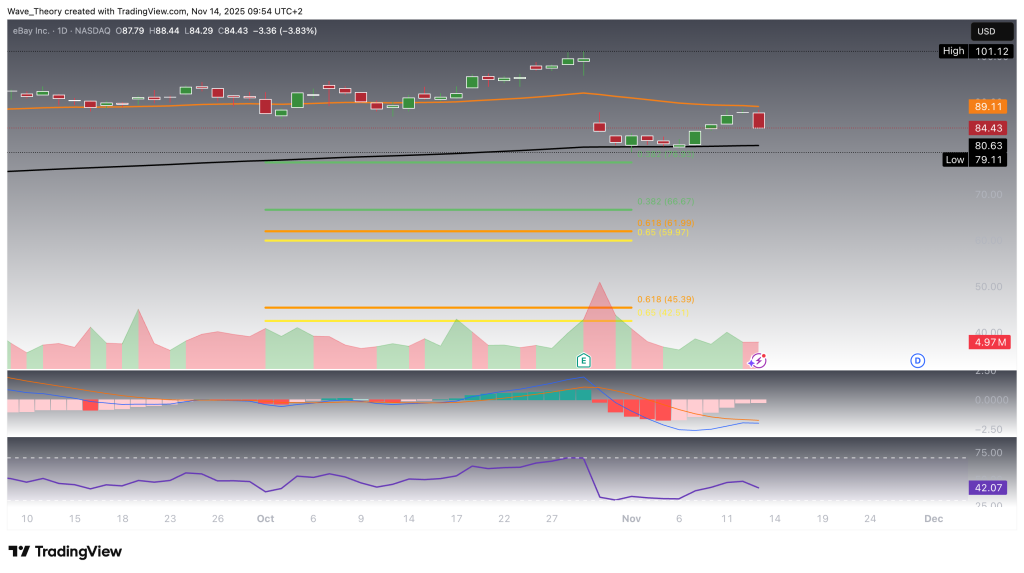
Today, eBay’s stock encountered resistance at the 50-day EMA near $89, resulting in a potential pullback toward the 200-day EMA at $80.60, which serves as the next significant support level.
Despite this short-term setback, the EMAs continue to display a golden crossover, confirming a bullish trend in the medium term. The MACD histogram remains positive, with the MACD lines showing the potential for a bullish crossover in the near term. Meanwhile, the RSI remains neutral, signaling no immediate overbought or oversold conditions.
Similar Outlook on the 4-Hour Chart
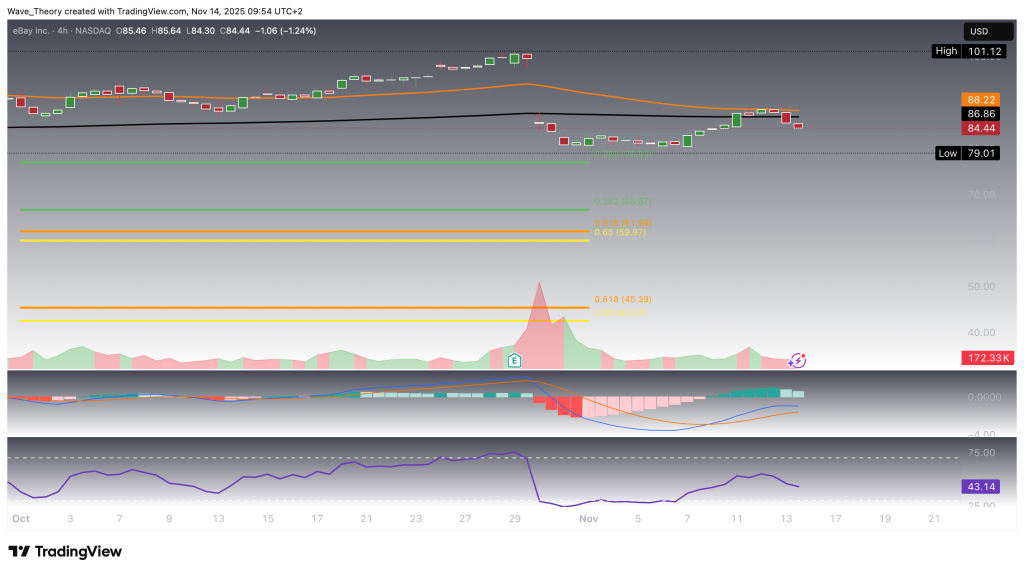
On the 4-hour chart, the 50-4H EMA aligns closely with the 50-day EMA at $88.22, acting as a strong resistance level. Currently, eBay appears to be extending its correction phase, which could drive the price toward the 0.382 Fibonacci support at $77.
Short-term indicators show caution: the EMAs may soon form a death cross, signaling a bearish trend in the near term. The MACD histogram is trending lower, though the MACD lines remain bullishly crossed, and the RSI continues to hover in neutral territory, indicating a balance between buying and selling pressure.
eBay Stock Technical Summary
-
Current Price: $84.40
-
Short-Term Resistance: 50-day / 50-4H EMA near $88–$89
-
Short-Term Support: 200-day EMA at $80.60, 0.382 Fib at $77
-
Medium-Term Trend: EMAs still display a golden crossover → bullish
-
Medium-Term Support: 50-week EMA & 0.382 Fib at $77–$78.30; next major support at $60 (50-month / 200-week EMA)
-
Long-Term Trend: Monthly EMAs maintain golden crossover → overall bullish trend intact
-
Long-Term Support: 200-month EMA at $39.60, golden ratio at $45
-
Indicators:
-
MACD: Mixed signals — bullish crossover in medium-term, short-term histogram ticking lower
-
RSI: Neutral across timeframes
-
Outlook:
-
Short-term: Potential pullback toward $77–$80.60 if resistance at $88–$89 holds
-
Medium- to long-term: Trend remains bullish as long as key weekly/monthly support levels hold
- Check out our free forex signals
- Follow the top economic events on FX Leaders economic calendar
- Trade better, discover more Forex Trading Strategies
- Open a FREE Trading Account
- Read our latest reviews on: Avatrade, Exness, HFM and XM
Related Articles

Sidebar rates
Related Posts
