Gold Price Forecast: Will the $4,550 Support Floor Hold or Cracks Deepen?
After a historic surge, Gold Spot (XAU/USD) dropped more than 10% in early February 2026 when the nomination of a hawkish Fed Chair...
Quick overview
- Gold Spot (XAU/USD) experienced a significant drop of over 10% in early February 2026, triggered by the nomination of a hawkish Fed Chair.
- The sell-off resulted in gold prices plummeting from a record high of $5,608 to lows near $4,400, marking the largest decline for precious metals since 1980.
- Key factors contributing to the crash included rising interest rate expectations, increased margin requirements, and halted Chinese inflows into leveraged gold accounts.
- Despite the sharp correction, long-term demand for gold remains strong, with institutions like J.P. Morgan maintaining optimistic year-end targets.
After a historic surge, Gold Spot (XAU/USD) dropped more than 10% in early February 2026 when the nomination of a hawkish Fed Chair triggered a major sell-off. This guide looks at the “Black Friday” reversal and the key technical levels traders are watching as the market searches for support near $4,600.
Gold prices saw a sharp drop on February 1 and 2, 2026, falling from a record high of $5,608 to lows near $4,400. This article explores how changing U.S. monetary policy expectations and a stronger dollar caused the gold bubble to burst. The sell-off was the biggest decline for precious metals since 1980, wiping out weeks of gains in just two days.
Key Takeaways
- Massive Correction: Gold fell roughly 3.14% to trade near $4,590 on February 2, extending a peak-to-trough drawdown of 17% from its January peak.
- Policy Trigger: The nomination of Kevin Warsh as the next Fed Chair signaled a potentially more hawkish path for interest rates, driving a sharp reversal in bullion’s uptrend.
- Silver Crash: Higher-beta silver experienced even more extreme volatility, plunging 36% from a record high of $122 to approximately $89.
- Margin Pressure: Global trading platforms, including CME Group, raised margin requirements on silver and gold futures, accelerating liquidations across leveraged accounts.
Gold’s 17% Drawdown Amid Policy Volatility
Even though long-term demand stayed strong, the rapid rally in January 2026 could not last. On February 2, spot gold fell another $215 to $4,676, making the two-day drop a total of $570.
The main story was the split between gold and the U.S. dollar, as investors took profits and moved into the stronger dollar. Analysts now see this as a “healthy correction” that helps clear out too much speculation and excitement.
What Caused the $570 Wipeout in Gold Price: Top 4 Reasons
The main reasons for the 2026 gold crash were a mix of political and technical factors:
- Hawkish Fed Nomination: Naming Kevin Warsh as Fed Chair made markets expect interest rates to stay higher for longer, which raised the cost of holding gold that does not pay interest.
- Margin Calls: Trading platforms around the world raised margin requirements. For example, CME Group increased silver margins from 9% to 11%, forcing traders to sell positions to cover costs.
- Halt in Chinese Inflows: Problems started when Chinese investors had trouble withdrawing money from leveraged gold accounts, causing several big funds to stop new subscriptions to control the rush.
- Parabolic Exhaustion: After climbing 67% in a year, gold entered a “speculative bubble” where prices moved away from the support of central bank buying.
Gold Price Forecast: Can the $4,550 Floor Hold?
Technically, the XAU/USD chart has gone from a sharp rise to a steep downward trend. The Relative Strength Index (RSI), which showed “overbought” levels above 80 before, has now dropped to around 40.
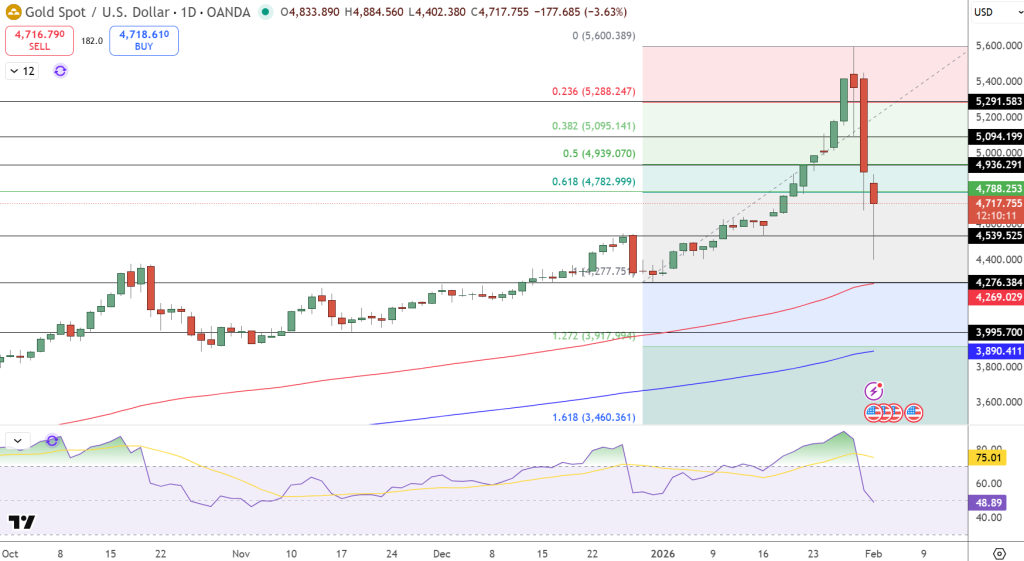
- Key Support: The 20-day Moving Average (MA) near $4,825 was recently broken, so the 50-day MA and the $4,550 level are now the next important support areas for buyers.
- Resistance: The nearest resistance is now at $4,930 and the key $5,000 level.
- Long-Term Targets: Even after the crash, big institutions are still optimistic. J.P. Morgan recently raised its year-end 2026 target to $6,300, pointing to ongoing central bank demand expected to reach 800 tonnes this year.
Trade Idea: Consider a short position if gold bounces back to $4,930, aiming for a retest of the $4,283 liquidity zone, and set a stop-loss above $5,050.
Bottom Line: Narrative Decay vs. Structural Demand
The 2026 gold “bloodbath” is a clear warning about the dangers of fast, story-driven price surges. While the move away from the dollar still supports gold in the long run, with emerging market central banks aiming for 15–25% of reserves in gold, short-term technical factors now dominate. For investors, this correction is a reminder: central bank buying can help set a floor, but it cannot stop a sharp drop when speculation gets out of hand.
- Check out our free forex signals
- Follow the top economic events on FX Leaders economic calendar
- Trade better, discover more Forex Trading Strategies
- Open a FREE Trading Account
- Read our latest reviews on: Avatrade, Exness, HFM and XM
Related Articles


Sidebar rates
Related Posts
