Gold Price Forecast: XAU/USD Rebounds Toward $4,850 After Brutal Post-Fed Liquidation
Gold is fighting to regain its composure on 19th March 2026 , after what many have dubbed "Black Wednesday...
Quick overview
- Gold is struggling to stabilize after a significant drop on March 19, 2026, losing nearly 4% of its value and falling below the $5,000 mark.
- The volatility is driven by a combination of hawkish Federal Reserve signals, persistent energy inflation, and a strengthening dollar.
- Despite the recent downturn, central banks are increasing their gold reserves, viewing the current prices as an opportunity amid geopolitical tensions.
- Technically, gold is in a bearish phase, with critical support at $4,804; failure to hold this level could lead to further declines.
Gold is fighting to regain its composure on 19th March 2026 , after what many have dubbed “Black Wednesday ” – a trading day where the precious metal lost almost 4% of its value. As we speak , spot gold is trading between $4,832 and $4,852 , desperately trying to find some stability after getting blown below the psychological $5,000 mark. The one thing that’s causing all this volatility is a triple whammy of hawkish Federal reserve signals, scorching inflation data and a shift in the way we perceive risk.
While the long-term case for gold is still pretty solid – with central banks still looking to diversify out of the US Dollar – for now its the short-term “higher for longer” interest rate story that is really driving the price action.
The Perfect Storm: Why Gold Cracked Under the $5,000 Mark
Gold’s price breakdown didn’t come from one single event . It was more like a perfect storm of macro headwinds that forced long positions to unwind at breakneck speed.
The main reasons behind that recent $300+ dive are:
- The Fed’s Sudden Shift: The Federal Reserve’s March 18th meeting caught everyone on their toes , sending a message that it may not be cutting interest rates at all in 2026 – or at least not as much as expected. This “higher for longer” stance makes gold a less attractive bet.
- Energy Inflation Still a Concern: With WTI Crude and Brent clocking in at $95-$100, its clear that energy-driven inflation is proving a lot stickier than we thought. February’s PPI numbers confirmed that prices are accelerating – leaving the Federal Reserve with no room to pivot to a more dovish stance.
- Dollar Strength is a Big Factor: The Dollar Index has made a big move up following PPI data, making it more expensive for international buyers to buy gold – and triggering automatic sell orders in the futures markets.
A Safety Net: Geopolitics Keeps the Market from Falling to Bits
Despite all the technical damage , gold isnt in free fall just yet. Ongoing conflict in the Middle East and threats to the Strait of Hormuz are keeping a floor under the market – and central banks are taking advantage of this to boost their gold reserves. They see the sub $5,000 price point as a great time to buy.
- Central Banks Buying Gold in Bulk: Global reserves are being restocked with gold at a record pace – and this is being driven by the trend of “de-dollarization” in response to fiscal concerns in the West.
- Flight to Safety: If things suddenly escalate with the US and Iran , we could see a massive rush for safe haven assets – and that could see gold reclaim the $5,000 level in a heartbeat.
Gold Technical Outlook : XAU/USD Bouncing Off $4,886
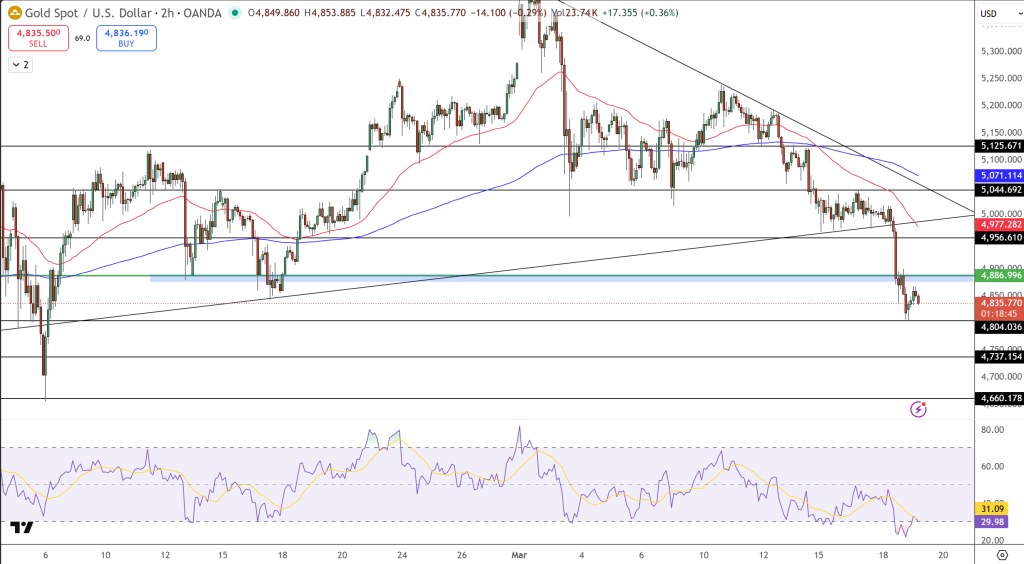
On the 2-hour chart , gold is definitely in a bearish phase after breaking through the $4,886 support zone. This breakdown killed off the trendline that had been in place for months – and now the near-term bias is firmly with the bears. Spot gold is way below its 50-period and 200-period moving averages – and those are acting as resistance.
The “line in the sand” for gold is $4,804. If that level fails to hold , we could be looking at a deeper pull back towards $4,737.
For gold to turn around , it must first reclaim $4,886. Beyond that, the $4,956-$4,977 zone (home to the 50 MA) will be a big buying opportunity.
The Relative Strength Index is hovering around 30 – which suggests the market is getting over-sold and might be due for a bounce. However, it doesn’t show the kind of divergence that would confirm we’ve hit the bottom.
- Check out our free forex signals
- Follow the top economic events on FX Leaders economic calendar
- Trade better, discover more Forex Trading Strategies
- Open a FREE Trading Account
- Read our latest reviews on: Avatrade, Exness, HFM and XM
Related Articles


Sidebar rates
Related Posts
