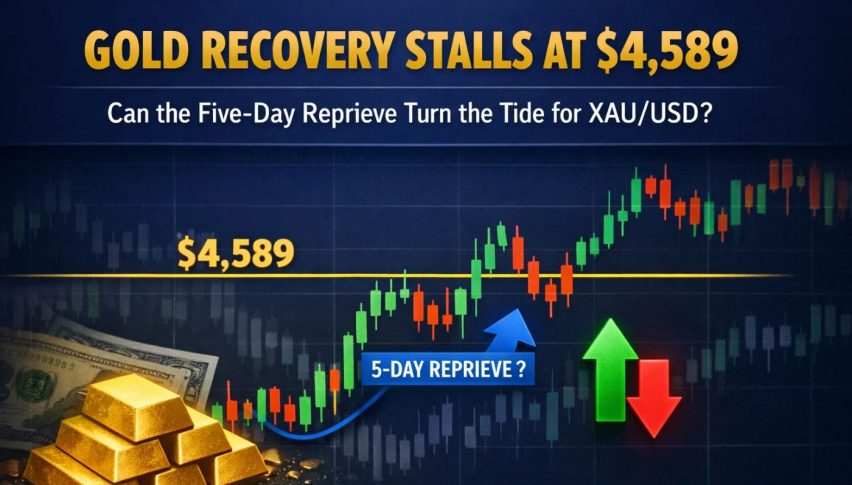
Gold Recovery Stalls at $4,589: Can the Five-Day Reprieve Turn the Tide for XAU/USD?
The gold market is still trying to find its footing after a truly wild ride. Currently, with spot gold (XAU/USD) trading around $4589...
Quick overview
- The gold market is currently trading around $4589, attempting to recover from a significant drop to a 2026 low of $4098.
- Despite a modest rebound, gold remains down 18% from its January peak of $5595, as investors weigh the impact of potential Fed rate hikes.
- Central banks continue to support gold, with forecasts suggesting a long-term price target of $6300 by the end of 2026.
- Recent geopolitical tensions and rising energy prices have pressured gold's appeal as a safe haven, leading to significant sell-offs.
The gold market is still trying to find its footing after a truly wild ride. Currently, with spot gold (XAU/USD) trading around $4589 on March 25 2026, it’s caught between a $4550 and $4600 per ounce recovery range. That modest 3% rebound is a desperate attempt to recoup some losses after a ‘Black Monday’ style meltdown that sent prices crashing to a 2026 low of $4098. The brief respite from price drops is largely thanks to the diplomatic detente: President Trump’s five day delay on striking Iranian energy facilities has kickstarted the unwinding of the panic that flipped gold from a safe haven to a cash cow for cash-strapped investors who needed to cover margin calls.
Despite this small upswing, the technical scars from that mid-March rout still linger. Gold is still down by a significant 18% from its January peak of $5595, as investors wrestle with whether gold’s long-term structural drivers will outweigh the need for a Fed rate hike.
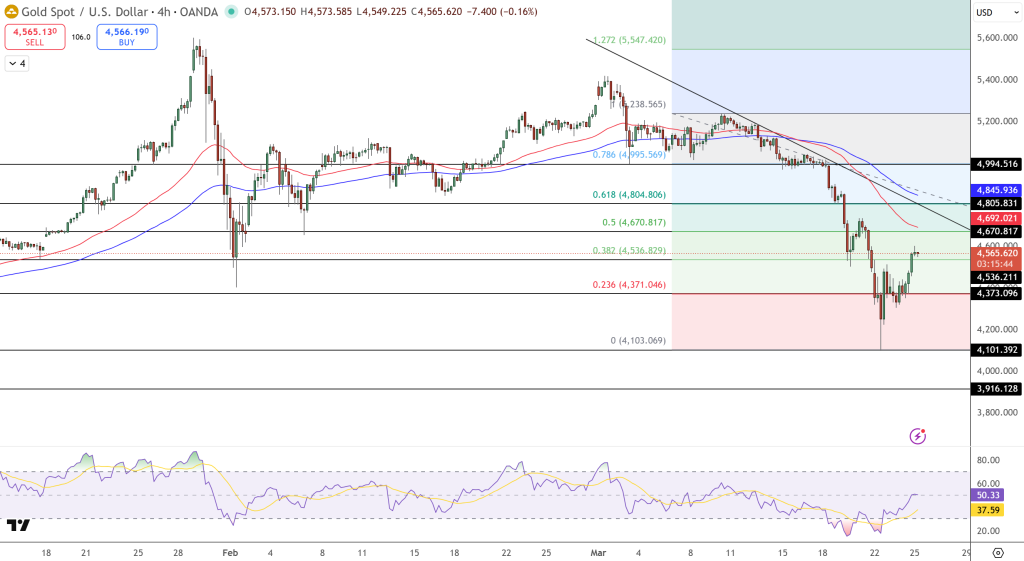
Gold (XAU/USD) Technical Outlook: The $4,670 Resistance “Line in the Sand”
On the 4 hour chart, gold has been trading around $4565 after taking a tentative step up from the $4373 level – which coincides with a .236 fibo retracement at $4371. But there’s still a lot of work to be done. That recent crash broke below the $4670 ( .5 fibo ) and $4804 ( .618 fibo ) supports, which sent a clear message that short term, the bearish are in control. And if that weren’t enough, the 50-period moving average at $4692 and the 200-period moving average at $4845 are both sitting on the other side of current prices, reinforcing that downward momentum.
When gold bounced up from $4373, it marked the end of a sharp selloff that briefly hit the $4101 major structural support. Buyers reacted strongly to that buy zone, pushing price up to the 0.382 fibo level at $4536. For the gold price to shift its short term bias back to neutral and start the movement towards 4805, it would need to clear $4670.
But on the downside, should we see a failure to hold above $4536, it could signal renewed pressure toward $4373 and even $4101. And as it stands, the Relative Strength Index is still making its way back up from oversold territory towards 50 – a sign that bearish momentum is easing but not a sign that we’ve seen a trend reversal yet.
Central Banks: The $6,300 Long-Term Conviction
While the small time traders are dumping their positions, the world’s central banks remain gold’s key supporters. The World Gold Council (WGC) maintains its forecast of 850 tonnes for 2026, which is closely in line with last year’s record buying pace.
- New Players: We’ve seen some new players like Indonesia and Malaysia entering the gold market for the first time in 2026, diversifying their reserves away from the US Dollar due to the spreading conflict in the West Asia region.
- China’s Buying Spree: China’s central bank has been buying gold for 16 straight months, with gold now making up nearly 10% of its total reserves.
- Bank Forecasts: Most major investment banks have stuck by their gold price targets, even after the big crash in March. JPMorgan is now forecasting $6300 at the end of 2026, while Deutsche Bank is still calling for $6000 – citing a clear structural trend of outperformance in real assets.
Macro Headwinds: The Inflation Paradox
The reason gold didn’t act as a safe haven for investors when the Iran conflict started was simple: an energy price shock. As oil prices spiked to $119, it caused investors to expect interest rates would stay in the 3.50-3.75% range for the rest of the year.
- Yield Pressure: As the 10-year Treasury yield rose to 4.25%, it made holding non-yielding gold a lot less attractive for investors.
- Liquidity Crisis: At the height of the conflict, gold was being sold off by institutional desks to cover equity market losses – the global market cap saw a $9 trillion hit.
The temporary reprieve we’ve seen in the Middle East has so far given us some relief from these pressures. If the diplomatic efforts hold, and oil prices drop back below $90, the US Dollar headwinds might ease off, allowing gold to regain its role as a long term hedge against currency debasement.
- Check out our free forex signals
- Follow the top economic events on FX Leaders economic calendar
- Trade better, discover more Forex Trading Strategies
- Open a FREE Trading Account
- Read our latest reviews on: Avatrade, Exness, HFM and XM
Related Articles


Sidebar rates
Related Posts
