Gold Price Forecast: Will Bearish Channel Pressures Drive Spot Gold Under $4,500?
Gold spot (XAU/USD) is currently sitting on razor-sharp technical edge, with the yellow metal at $4,518.71 during an aggressive intraday...
Quick overview
- Gold spot (XAU/USD) is currently at $4,518.71, facing significant pressure within a descending channel amid macroeconomic uncertainty.
- Recent inflation data and the appointment of new Federal Reserve chairman Kevin Warsh have led to increased real rates, strengthening the US dollar.
- Despite rising crude oil prices, which typically support gold, the immediate impact has been negative for non-yielding precious metals like gold.
- A bearish technical outlook suggests potential further declines, with key support levels at $4,518.00 and $4,500.00, while traders should monitor volume for signs of a reversal.
Gold spot (XAU/USD) is currently sitting on razor-sharp technical edge, with the yellow metal at $4,518.71 during an aggressive intraday 0.20% distribution sweep on Monday morning. The safe-haven asset has found itself moving along the low-water mark of a strong parallel descending channel on the four-hour chart, undergoing significant structural range compression as macroeconomic policy data gets fully digested in this turbulent global banking environment.
Today’s Catalysts
- The Warsh Policy Impasse: Macroeconomic capital allocations are responding aggressively to a restrictive fundamental background following the official White House swearing-in ceremony of the new Federal Reserve chairman, Kevin Warsh. With April’s sticky CPI printing a 3.8% on headline and 4.1% on core, institutional desks have officially abandoned any near-term expectations for interest rate cuts. This has helped lift real rates, strengthening the US dollar.
- Inflation Fears Triggered by Crude Gains: Gold’s upside trajectory faces mixed forces as WTI crude futures move higher by more than 2%, heading toward the $100 mark. While higher crude oil is typically bullish for gold’s long-term appeal as an inflation hedge, in the immediate term, crude oil prices have actually bolstered the US dollar and accelerated the selling pressure in non-yielding precious metals.
- The 17-Month Central Bank Safety Net: Heavy institutional buying has prevented deeper market selling. Specifically, the central bank of China has been ramping up its purchase of physical gold for more than 17 consecutive months as part of a broader effort by emerging-market central banks to help prop up prices during times of futures market distributions.
Technical Breakdown
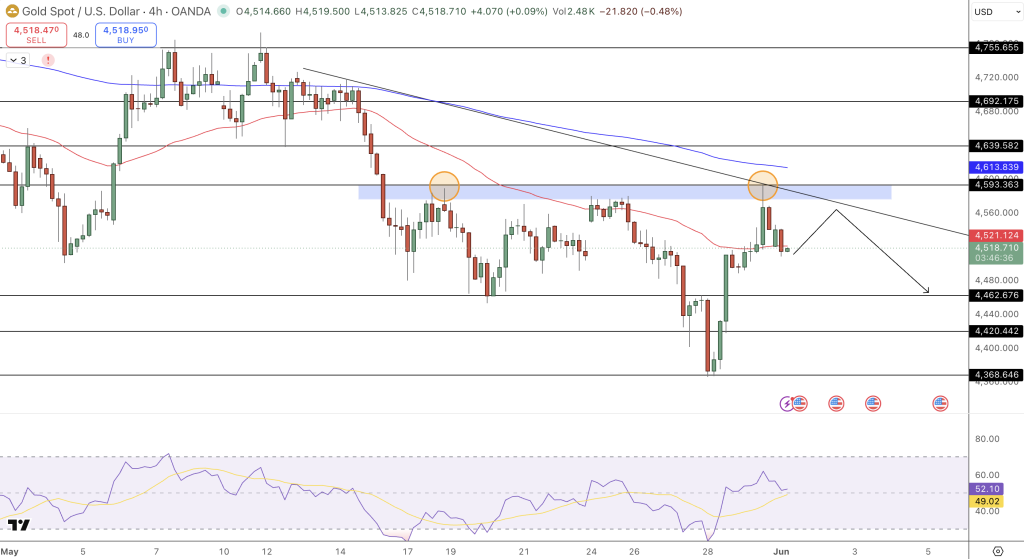
The four-hour chart shows an orderly breakdown formation with clear bearish continuation elements. Spot gold remains confined within the bounds of a well-defined descending channel, as price has fallen from its cyclical high at $4,755.00 just recently, posting a sequence of lower highs below a series of descending trendlines.
Price is currently stuck against the immediate $4,518.00 horizontal support shelf. Sellers have been able to reject price at both the overhead black and red trendlines with heavy volume, leading to larger red candlesticks appearing on the chart. The 14-period RSI is flat at a neutral-bearish 49.0 reading, showing that momentum indicators remain far from overbought conditions and are free for a drop lower.
- Resistance: $4,546.00 (Trendline confluence barrier), $4,574.00, and major swing points higher at $4,610.00.
- Support: $4,518.00 (Recent support), $4,500.00 (Recent support), and the major target level lower at $4,420.00.
Trade Idea
The trend-following setup for a continued move lower is forming, as price stalls at the lows of its trading range in the short-term.
- Order: Sell Stop execution on a confirmed four-hour candlestick close below $4,518.00
- Target 1: $4,500.00
- Target 2: $4,420.00
- Stop Loss: Above the consolidation area at $4,546.00
Final Thoughts
Our short-term technical outlook for gold suggests it will undergo more testing in the near-term and is in a structural reset phase, as a key resistance level at $4,518.00 is put to the test ahead of this week’s big Fed speech series. The long-term case for gold as an asset class still stands based on the growing imbalances in the global financial markets.
Western governments are expanding sovereign debt and reserves are going to central banks are being sold for gold, and this trend will keep gold attractive over the next few months. The only issue is that immediate price levels are firmly controlled by automated momentum bears. Traders should watch volume levels at the support area for signs of an uptick before going long until gold finally bottoms out in the short-term.
- Check out our free forex signals
- Follow the top economic events on FX Leaders economic calendar
- Trade better, discover more Forex Trading Strategies
- Open a FREE Trading Account
- Read our latest reviews on: Avatrade, Exness, HFM and XM
Related Articles


Sidebar rates
Related Posts
