GBP/USD Price Analysis: Sterling Stalls at $1.3351 as Iran Deadline, US PCE Data, and a Fibonacci Trap Converge
GBP/USD is trading at $1.3351 on March 26, 2026, coiling at a critical Fibonacci crossroads inside a rising channel...
Quick overview
- GBP/USD is currently trading at $1.3351, influenced by geopolitical tensions surrounding Iran and upcoming economic data releases.
- The Bank of England's shift from anticipated rate cuts to potential hikes is reshaping the currency's fundamental outlook.
- Technical analysis shows GBP/USD facing resistance at key Fibonacci levels, with a bearish bias developing as price struggles to break through.
- Key economic indicators on Friday, including UK Retail Sales and US PCE inflation, could significantly impact the pair's direction.
GBP/USD is trading at $1.3351 on March 26, 2026, coiling at a critical Fibonacci crossroads inside a rising channel. With a US deadline on Iran looming and two high-impact data releases due Friday — UK Retail Sales and US PCE — the next 24 hours could define the pair’s near-term direction.
What Is Driving GBP/USD Today?
The dominant force behind GBP/USD price action right now is geopolitical. The pound briefly recovered toward $1.34 after President Trump delayed US strikes on Iran, citing productive talks. Iran’s state media immediately denied any negotiations, and markets remain on edge around the 48-hour US deadline for Iran to reopen the Strait of Hormuz.
Any escalation would spike energy prices further and weigh on both currencies — though the UK, as a net energy importer, faces greater exposure than the US. This asymmetric vulnerability continues to cap sterling’s upside on risk-off moves.
Bank of England Policy Reversal: From Cuts to Hikes
The Bank of England has executed a dramatic policy reversal that is reshaping GBP/USD’s fundamental framework. Pre-conflict, markets were pricing in two BoE rate cuts in 2026. Now, with UK CPI holding at 3.0% and core CPI edging above 3.2%, investors are pricing in multiple rate hikes.
The BoE holds at 3.75%, now matching the Federal Reserve — which eliminates the traditional rate differential pressure that typically drags sterling lower against the dollar. For GBP/USD traders, this is the key fundamental shift: the pair is no longer fighting a wide rate gap.
GBP/USD Technical Analysis: A Fibonacci Trap in a Rising Channel
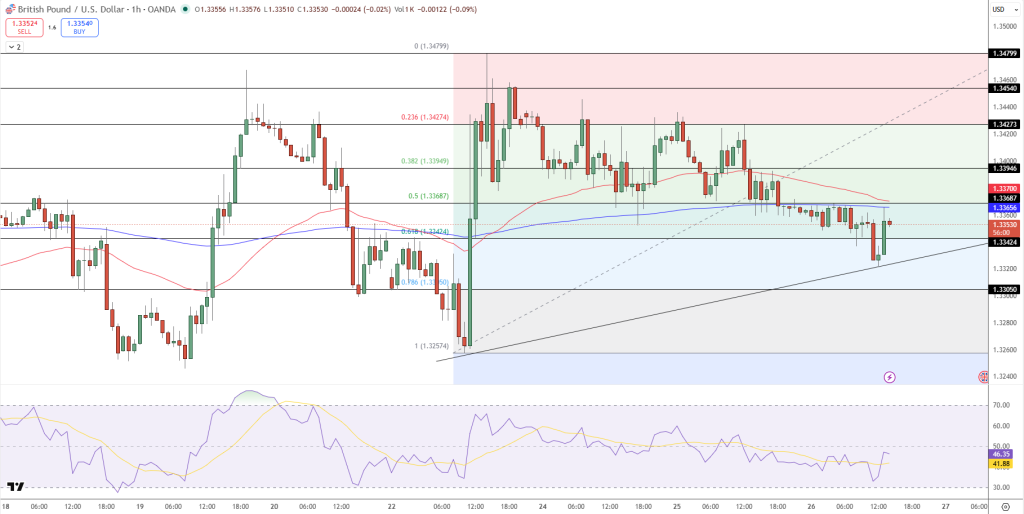
The 1-hour chart presents a technically rich and clearly defined setup.
After an impulsive drop from $1.3480 to the Fibonacci 100% extension at $1.3257, Cable staged a strong recovery — reclaiming the 78.6% retracement level at $1.3335 and the 61.8% level at $1.3342. Price has since formed a rising channel, with trendline support near $1.3320 and a resistance shelf capping rallies between $1.3395 and $1.3400.
The bearish case is building at current levels. Every attempt to push through the Fibonacci 50% level at $1.3369 and the 38.2% retracement at $1.3395 has been rejected with shooting star and spinning top candlestick patterns — classic signs of exhaustion at resistance. The short-term EMA is threatening a bearish crossover from above the longer-term EMA, and both RSI signal lines remain below 50, with a mild bearish divergence forming: price made a higher swing, but momentum failed to confirm.
GBP/USD trade setup (short bias): Sell on rejection at $1.3365–$1.3395 | Stop above $1.3425 | Target $1.3305, then $1.3257 on a channel breakdown.
Two Catalysts That Will Decide GBP/USD Direction on Friday
UK Retail Sales (February) — prints Friday morning. January came in at a strong 1.8% surprise, but that data predates the Middle East conflict. A miss here would confirm the energy shock is already hitting UK households — and would add downside pressure to sterling.
US PCE inflation data — the Federal Reserve’s preferred inflation gauge lands shortly after. A hot PCE reading would push back Fed rate cut expectations and lift the US dollar, putting $1.3300 firmly in play for GBP/USD.
FAQ: GBP/USD — Iran, BoE, and Fibonacci Levels Explained
Why is GBP/USD falling in March 2026?
GBP/USD is under pressure due to a combination of Middle East geopolitical risk, rising UK energy import costs from the Iran conflict, and a stronger US dollar supported by safe-haven demand. The pair is also facing technical resistance at key Fibonacci retracement levels between $1.3369 and $1.3395.
What is the GBP/USD forecast for this week?
The short-term bias is bearish. If UK Retail Sales disappoint or US PCE comes in above expectations on Friday, GBP/USD could break below the rising channel and target $1.3305, then $1.3257. A bullish resolution requires a clean break above $1.3400.
How does the Iran conflict affect GBP/USD?
The UK is a net energy importer, meaning rising oil and gas prices from Middle East disruption increase UK inflation and pressure real household incomes. This makes sterling more vulnerable than the dollar during energy-driven risk-off periods, creating a bearish GBP/USD bias when conflict escalates.
What does the Bank of England’s rate decision mean for the pound?
The BoE’s shift from pricing in two cuts to multiple rate hikes has partially supported the pound. With the BoE now at 3.75% — matching the Fed — the rate differential that typically weakens sterling has closed, limiting the downside for GBP/USD on a fundamental basis.
What are the key GBP/USD support and resistance levels today?
Key support sits at $1.3320 (rising channel trendline), then $1.3305 and $1.3257 (Fibonacci 100% extension). Resistance is at $1.3369 (Fibonacci 50%), $1.3395 (Fibonacci 38.2%), and $1.3400–$1.3425.
- Check out our free forex signals
- Follow the top economic events on FX Leaders economic calendar
- Trade better, discover more Forex Trading Strategies
- Open a FREE Trading Account
- Read our latest reviews on: Avatrade, Exness, HFM and XM
Related Articles


Sidebar rates
Related Posts
