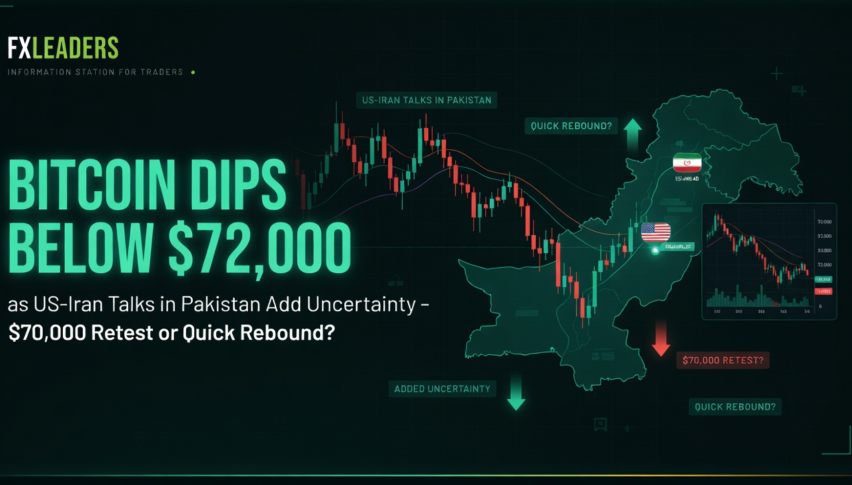
Bitcoin Dips Below $72,000 as US-Iran Talks in Pakistan Add Uncertainty – $70,000 Retest or Quick Rebound?
Bitcoin had been rising towards three-week highs of $72,800 earlier in the week with the US-Iran ceasefire looking like it might finally...
Quick overview
- Bitcoin is currently trading around $71,075, down 2.3% in the last 24 hours from a high of $73,000.
- Recent geopolitical tensions and ongoing talks in Pakistan have contributed to price fluctuations, with Bitcoin previously rising to $72,841.
- April has historically been a strong month for Bitcoin, but this year has seen back-to-back quarterly losses.
- Technical analysis indicates a shift from bullish to bearish sentiment, with key support levels around $70,655 and $69,500.
Bitcoin is currently trading in the $71,000-$73,000 range, hovering around $71,075 at mid-day UTC (down a not-insignificant 2.3% in the last 24 hours from a high of around $73,000 on April 11). Trading volume is still pretty high, coming in at over $28 billion.
Recent Price Action
Bitcoin had been rising towards three-week highs of $72,800 earlier in the week with the US-Iran ceasefire looking like it might finally bring some stability to the situation. But now that we’re seeing some uncertainty creeping back in with the ongoing talks in Pakistan, prices have started to pull back a bit.
We’ve been seeing a pretty tight range for the past couple of months – basically between $60,000 and $75,000 – and that’s been reflected in some pretty low trading volumes and a general air of caution in the market.
April tends to be a pretty good month for Bitcoin, historically speaking – we’re talking positive closes 9 out of 13 times since 2013. But this year has been different – we’ve seen back-to-back quarterly losses, which is something we haven’t seen since 2022.
Key Drivers Today
The Geopolitical Situation: when it looked like the US-Iran ceasefire was a done deal, Bitcoin surged pretty quickly, getting up as high as $72,841. But with the talks still ongoing in Islamabad today (April 12) and reports of some delays or cautious progress, prices have started to fall back. If the talks break down or we see a renewed escalation in tensions, we might see some investors playing it safe and jumping into Bitcoin, which could well send prices back up. But if things do finally come to a head and we see some kind of agreement, that could change the whole risk dynamic for Bitcoin.
The Macro Picture: We’re still seeing some pretty tough inflation data, and the Fed is still talking about interest rates, and there’s all sorts of uncertainty around the energy markets because of the Strait of Hormuz situation – all of which is making life pretty tough for Bitcoin right now. Some people are watching to see whether there might be some kind of ‘stealth liquidity’ injection into the market after the middle of April – that could be a catalyst later this month.
The Big Players and On-Chain Activity: The fact that some of the ETFs have been pretty active has helped calm the market down a bit. There are still lots of people talking about Bitcoin’s origins, and some of the big companies and treasuries that hold it – but some of those people are facing some pretty hefty unrealized losses at the moment, given how much the price has swung around this year.
Bitcoin (BTC/USD) Technical Analysis
Looking at the charts, we can see that Bitcoin has broken out of its short-term ascending channel, which is a pretty clear sign that the market is shifting from a bullish to a bearish mood right now. And with the price coming in at $71,000, we’ve got a bit of a test coming up for the $72,000 mark, which was previously a support level. The rejection from the $73,800-$74,000 supply zone was a pretty clear sign that the market is running out of steam.
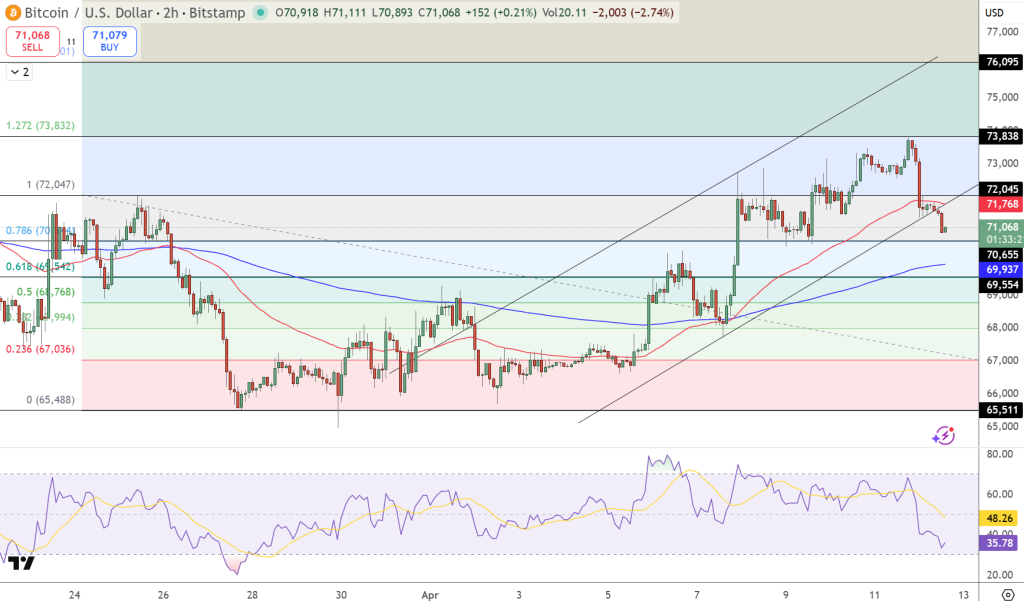
If we do start to see some more selling pressure come in, the first level of support we’d expect to see would be around $70,655, followed by a bigger confluence zone around $69,500 to $69,900 – that’s the 200 EMA and the 0.618 Fibonacci level, and if we break below that, we could see a pretty sharp sell-off all the way down to $67,000.
On the other side of things, if we can somehow manage to get the price back up above $72,000-$72,500, that would be a pretty clear sign that the market has turned bullish again – and that would get us back up towards $73,800.
The RSI has dropped pretty sharply towards 35, which is bearish territory and getting close to oversold levels, which tends to trigger some pretty short-term bounces. But it’s not yet clear whether that’s going to be enough to turn the market around.
Forecast: If the price holds under $72,000, we’re looking at a bearish move down to $70,600 – and if it breaks under $70,000, that could trigger a bit of a stampede on the downside, while if we can somehow manage to get above $72,500, that would pretty clearly turn the market around.
- Check out our free forex signals
- Follow the top economic events on FX Leaders economic calendar
- Trade better, discover more Forex Trading Strategies
- Open a FREE Trading Account
- Read our latest reviews on: Avatrade, Exness, HFM and XM
Related Articles


Sidebar rates
Related Posts
